Gold Coast.
Australia's premier coastal city combines pristine oceanfront geography with an architectural renaissance, creating one of the country's most resilient prestige property markets.
Off the Plan Projects in Gold Coast.
Developer, price guide, completion and sales status for every project we currently represent in Gold Coast, ordered by completion.
| Project | Suburb | Developer | Price guide | Completion | Status |
|---|---|---|---|---|---|
| Orama | Chevron Island | Aniko Group | From $1,395,000 | November 2026 | Final Release |
| Faro | Broadbeach | 5Point | From $5,000,000+ | Complete, move in ready | Now Selling |
| 39 Peerless | Mermaid Beach | Abedian & Co | From $4,600,000 | Mid 2027 | Now Selling |
| Greenmount Residences | Coolangatta | Abedian & Co | From $4,900,000 | Late 2027 | Now Selling |
| Iconica | Surfers Paradise | Meriton | From $1,211,000 | 2027 / 2028 | Now Selling |
| Como | Varsity Lakes | Red & Co | From $1,050,000 | Late 2027 | Now Selling |
| The Landmark | Mermaid Beach | Aniko Group | From $1,495,000 | Late 2028 | Now Selling |
| Cypress Palms | Surfers Paradise | Meriton | From $821,000 | 2028 / 2029 | Now Selling |
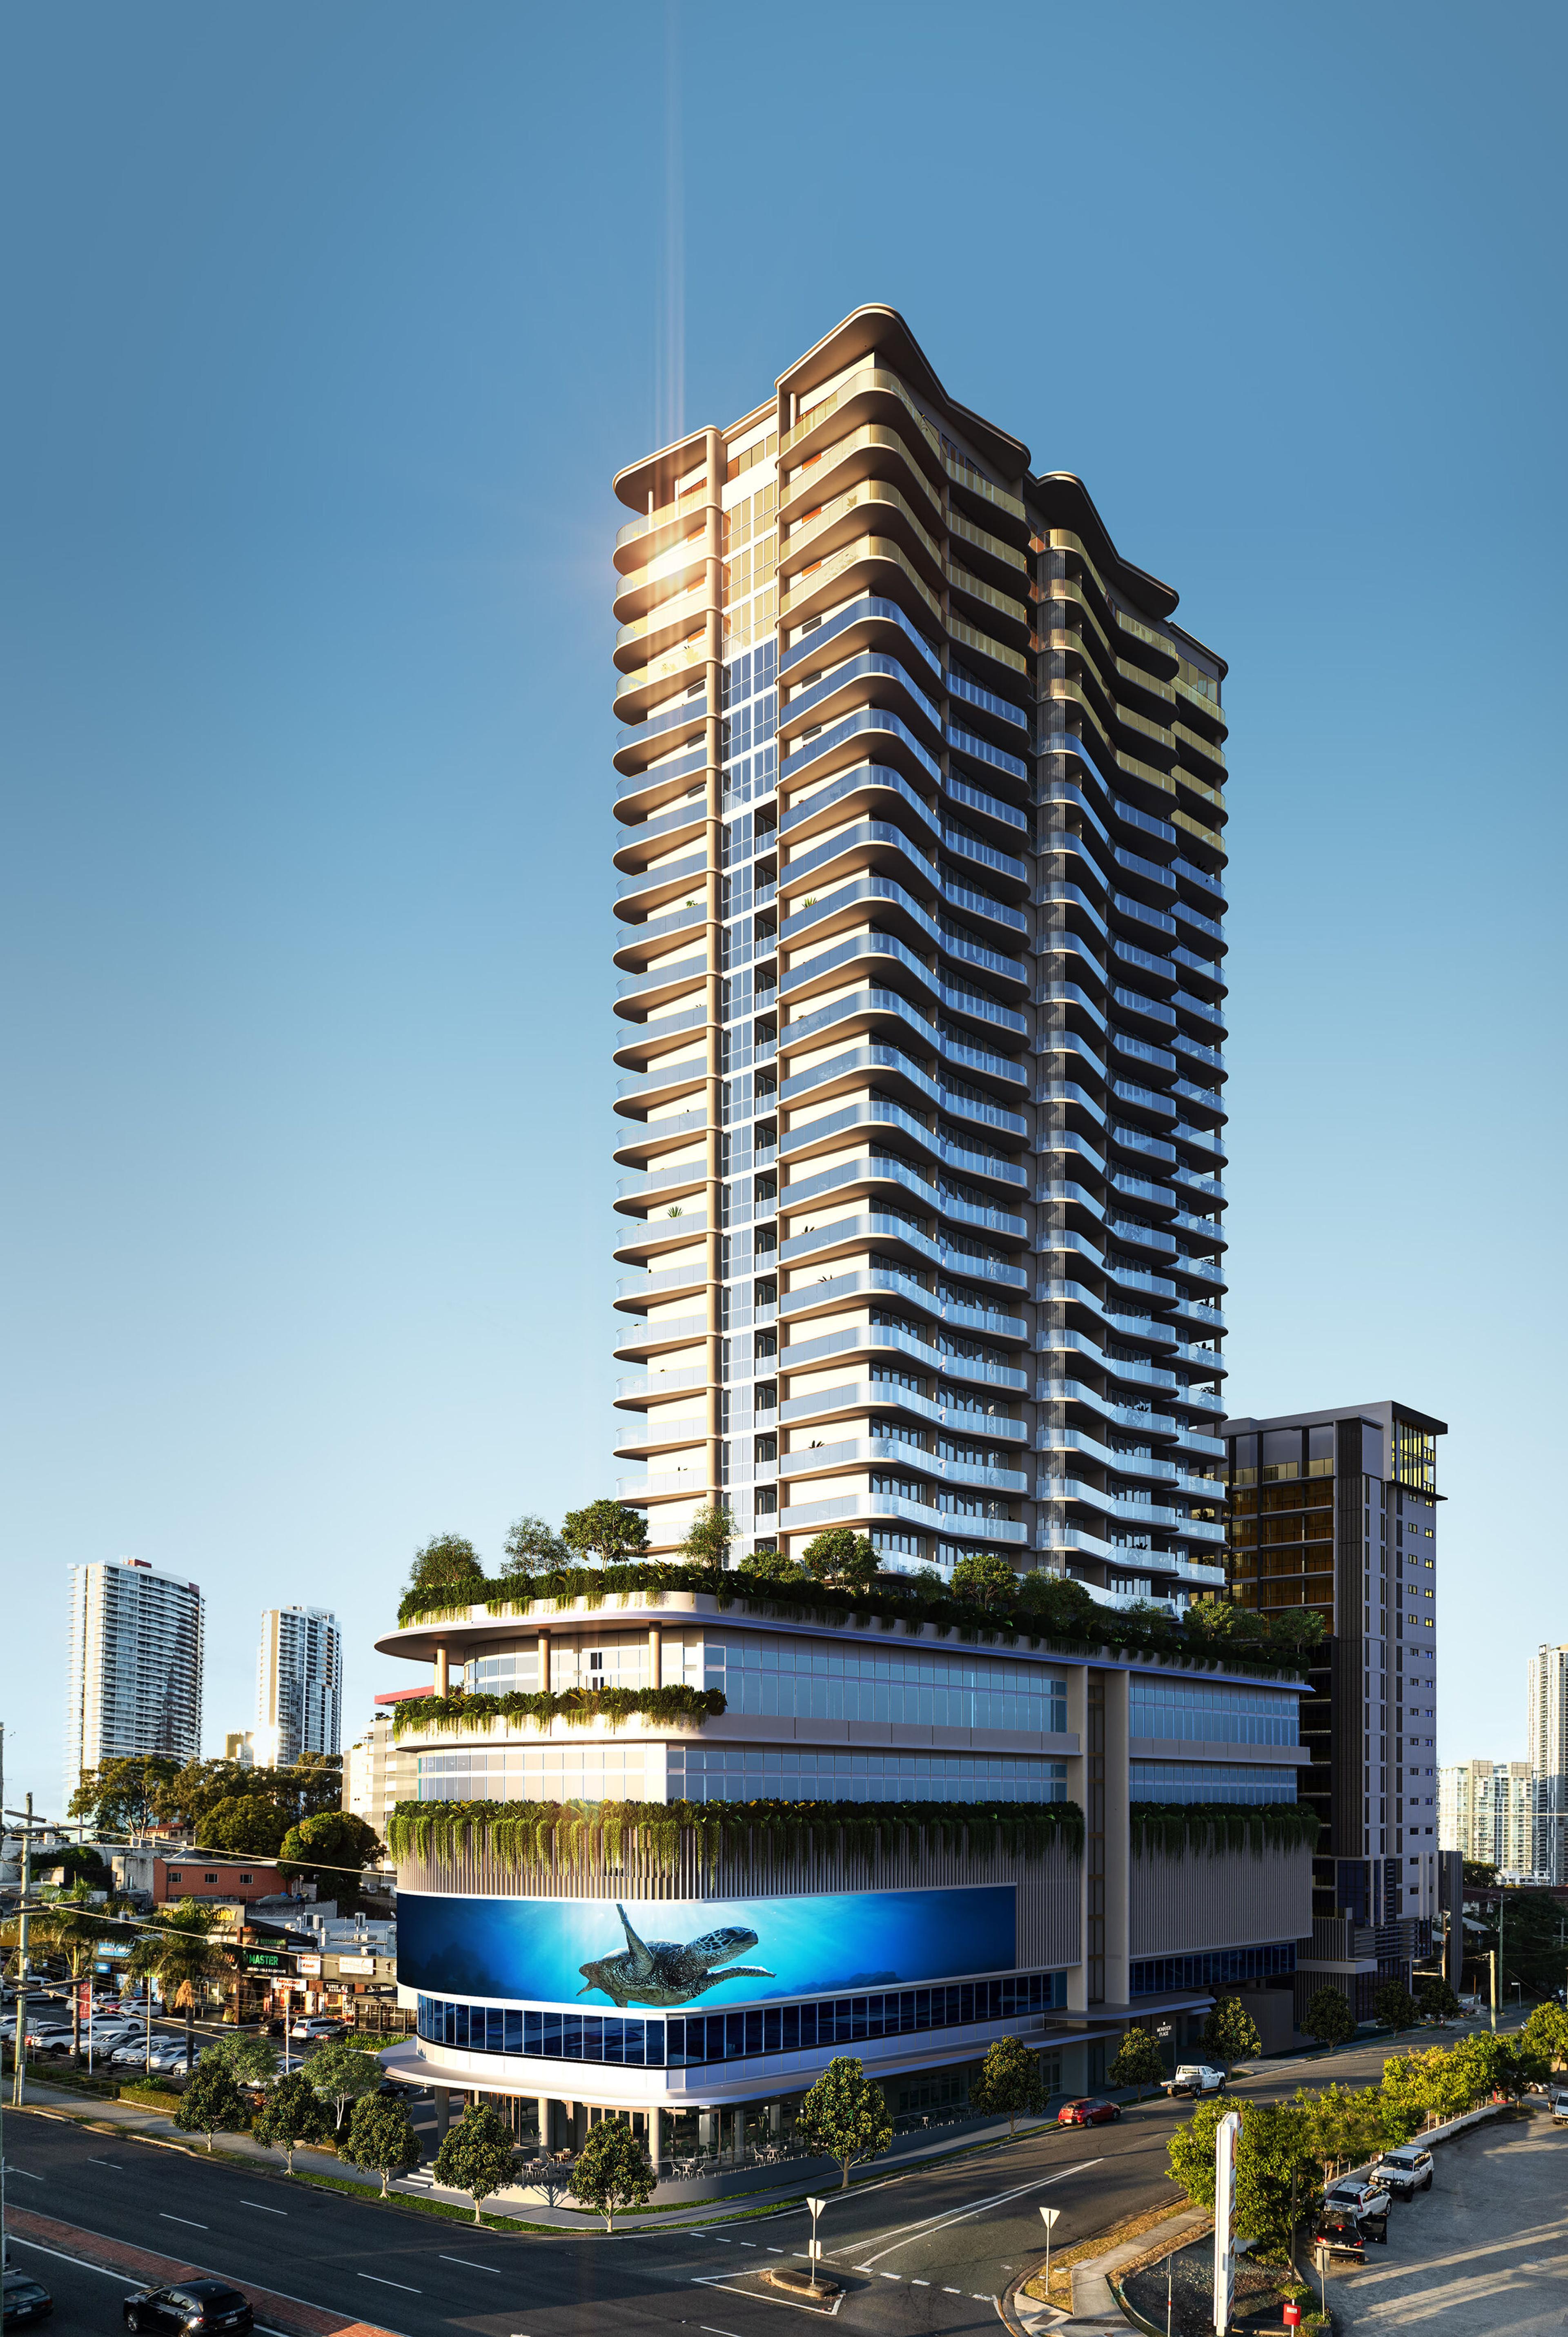
| Monarch Place | Southport | Azzura | From $1,052,500 | Early 2028 | Now Selling |
| The Eveleigh | Broadbeach | Hirsch & Faigen | From $2,870,000 | 2028 | Now Selling |
| Lumara | Broadbeach | 5Point | Contact Agent | Mid 2028 | Now Selling |
| Victoria & Albert | Broadbeach | Iris Capital | From $1,750,000 | Mid 2028 | Now Selling |
| Marina Mirage | Main Beach | Makris Group | Contact Agent | 2029 | Now Selling |
| 18 Mary Avenue | Broadbeach | Abedian & Co | From $2,850,000 | Late 2030 | Now Selling |
| Harbour Shores | Biggera Waters | Lewis Land | From $788,000 | Mid 2028 | Now Selling |
| Bronze on Chevron | Chevron Island | Gardner Vaughan Group | From $1,640,000 | Early 2029 | Now Selling |
The Gold Coast Property Market.
Defined by fifty-seven kilometres of uninterrupted coastline and backed by the dramatic ridgelines of the ancient Hinterland, the Gold Coast has evolved into Australia's preeminent coastal capital. Long appreciated for its subtropical climate and surf breaks, the city has undergone a profound structural transformation. A sustained influx of interstate leaders, affluent families, and seasoned investors has reshaped the cultural and economic landscape, turning once-seasonal holiday pockets into sophisticated year-round enclaves where unhurried coastal living exists alongside world-class private dining, medical precincts, and tertiary institutions.
At the centre of this evolution is an architectural renaissance that has permanently elevated the skyline. New residential developments have shifted decisively away from compact short-term tourist accommodation toward expansive, owner-occupier residences conceived by leading Australian architects. These homes are designed for permanent living, showcasing house-sized floorplans, private lift lobbies, deep sheltered entertaining terraces, and high-performance acoustic glazing that frames uninterrupted panoramas from the Pacific Ocean to the coastal ranges.
Daily life on the Gold Coast is anchored by distinct village personalities. To the south, Burleigh Heads, Palm Beach, and Currumbin offer a relaxed surf culture where morning ocean swims lead seamlessly into artisan bakery counters, beachside espresso, and destination dining. Moving north, Broadbeach and Main Beach deliver cosmopolitan sophistication with award-winning restaurants along Surf Parade and Tedder Avenue, while the Broadwater foreshore provides protected marine anchorages for boating and waterfront recreation.
Underpinning the long-term value of Gold Coast property is an unyielding geographical constraint. Slenderly bound between the Pacific Ocean to the east and protected national parks to the west, developable land along the coastal corridor is strictly finite. With the active expansion of the G:link Light Rail toward Burleigh Heads, multi-billion-dollar upgrades along the M1 corridor, and the countdown to the 2032 Olympic Games, the region couples permanent structural scarcity with nation-leading demographic demand.
Gold Coast Market Profile
2008 – 2025 Historical Analysis
Houses Median
$1,147,500+14.2% 1yr
Houses 5-Yr Growth+98.2%
Units Median
$845,000+8.5% 1yr
Units 5-Yr Growth+94.3%
Origin:Jun 2008
Latest:Jun 2025
Source: Cotality & ABS
Stratified historical median pricing derived from ABS and Cotality transaction records. General information only, not financial advice.
Gold Coast Market Profile Historical Sales Records
| Quarter | Houses Median Price | Units Median Price |
|---|---|---|
| Jun 2008 | $435,000 | $350,000 |
| Sep 2008 | $430,000 | $350,000 |
| Dec 2008 | $395,000 | $337,000 |
| Mar 2009 | $415,000 | $345,000 |
| Jun 2009 | $435,000 | $340,000 |
| Sep 2009 | $435,000 | $353,000 |
| Dec 2009 | $446,500 | $374,000 |
| Mar 2010 | $449,000 | $372,000 |
| Jun 2010 | $455,000 | $356,000 |
| Sep 2010 | $430,000 | $345,000 |
| Dec 2010 | $430,750 | $364,000 |
| Mar 2011 | $423,000 | $340,000 |
| Jun 2011 | $409,000 | $330,000 |
| Sep 2011 | $400,000 | $315,000 |
| Dec 2011 | $395,000 | $315,000 |
| Mar 2012 | $386,000 | $305,000 |
| Jun 2012 | $387,000 | $315,000 |
| Sep 2012 | $398,000 | $310,000 |
| Dec 2012 | $410,000 | $305,000 |
| Mar 2013 | $409,000 | $305,000 |
| Jun 2013 | $399,000 | $310,000 |
| Sep 2013 | $412,500 | $317,000 |
| Dec 2013 | $425,000 | $318,000 |
| Mar 2014 | $445,000 | $345,000 |
| Jun 2014 | $445,000 | $345,000 |
| Sep 2014 | $447,000 | $340,000 |
| Dec 2014 | $460,000 | $335,000 |
| Mar 2015 | $465,000 | $350,000 |
| Jun 2015 | $463,000 | $344,000 |
| Sep 2015 | $485,000 | $360,000 |
| Dec 2015 | $498,200 | $365,000 |
| Mar 2016 | $500,000 | $370,000 |
| Jun 2016 | $520,000 | $380,000 |
| Sep 2016 | $520,000 | $395,000 |
| Dec 2016 | $540,000 | $385,000 |
| Mar 2017 | $537,500 | $398,000 |
| Jun 2017 | $550,000 | $415,000 |
| Sep 2017 | $550,000 | $410,000 |
| Dec 2017 | $551,000 | $415,000 |
| Mar 2018 | $563,000 | $420,000 |
| Jun 2018 | $565,000 | $412,000 |
| Sep 2018 | $570,000 | $405,000 |
| Dec 2018 | $561,000 | $422,000 |
| Mar 2019 | $552,000 | $410,000 |
| Jun 2019 | $550,000 | $410,000 |
| Sep 2019 | $555,000 | $425,000 |
| Dec 2019 | $572,000 | $415,000 |
| Mar 2020 | $579,000 | $435,000 |
| Jun 2020 | $579,000 | $435,000 |
| Sep 2020 | $595,000 | $445,000 |
| Dec 2020 | $624,500 | $455,000 |
| Mar 2021 | $682,000 | $490,000 |
| Jun 2021 | $725,000 | $519,000 |
| Sep 2021 | $766,000 | $550,000 |
| Dec 2021 | $840,000 | $588,000 |
| Mar 2022 | $900,000 | $633,110 |
| Jun 2022 | $901,000 | $660,000 |
| Sep 2022 | $891,000 | $650,000 |
| Dec 2022 | $880,000 | $650,000 |
| Mar 2023 | $865,000 | $665,000 |
| Jun 2023 | $900,000 | $689,000 |
| Sep 2023 | $915,000 | $715,000 |
| Dec 2023 | $920,000 | $720,000 |
| Mar 2024 | $950,000 | $750,000 |
| Jun 2024 | $1,005,000 | $779,000 |
| Sep 2024 | $1,000,000 | $780,000 |
| Dec 2024 | $1,040,000 | $793,000 |
| Mar 2025 | $1,075,000 | $822,000 |
| Jun 2025 | $1,147,500 | $845,000 |
Market Insights for Gold Coast.
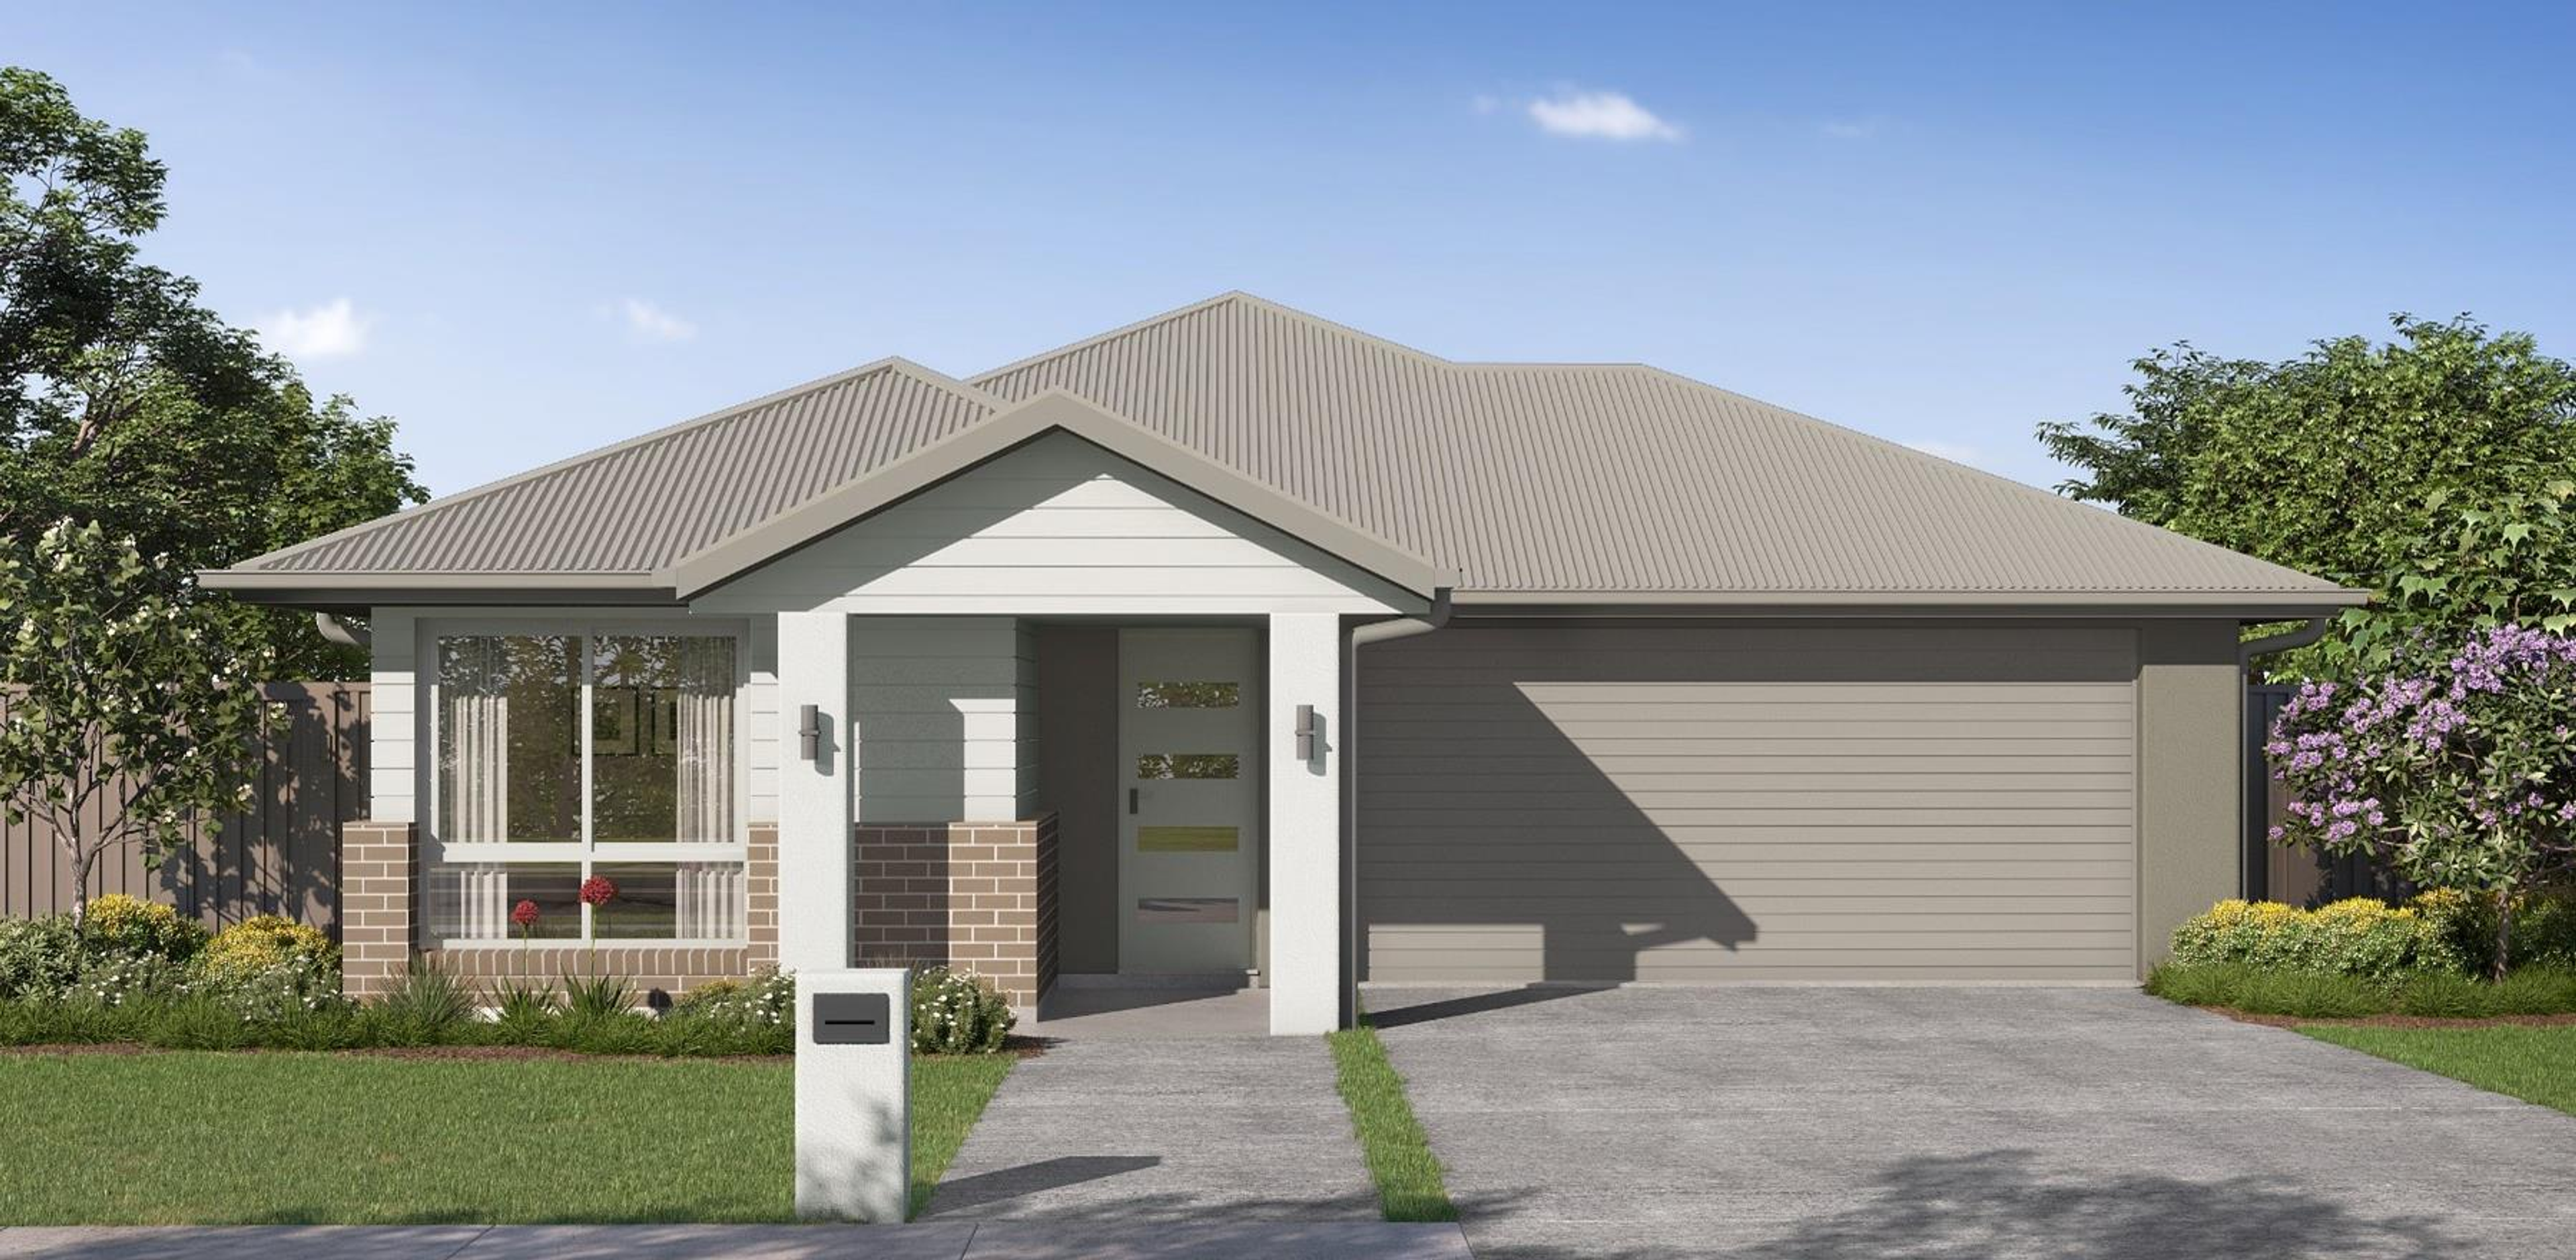
SUBURB GC
3 min read
23 Oct 2026
Stone Creek Upper Coomera Review & Guide
Read Article
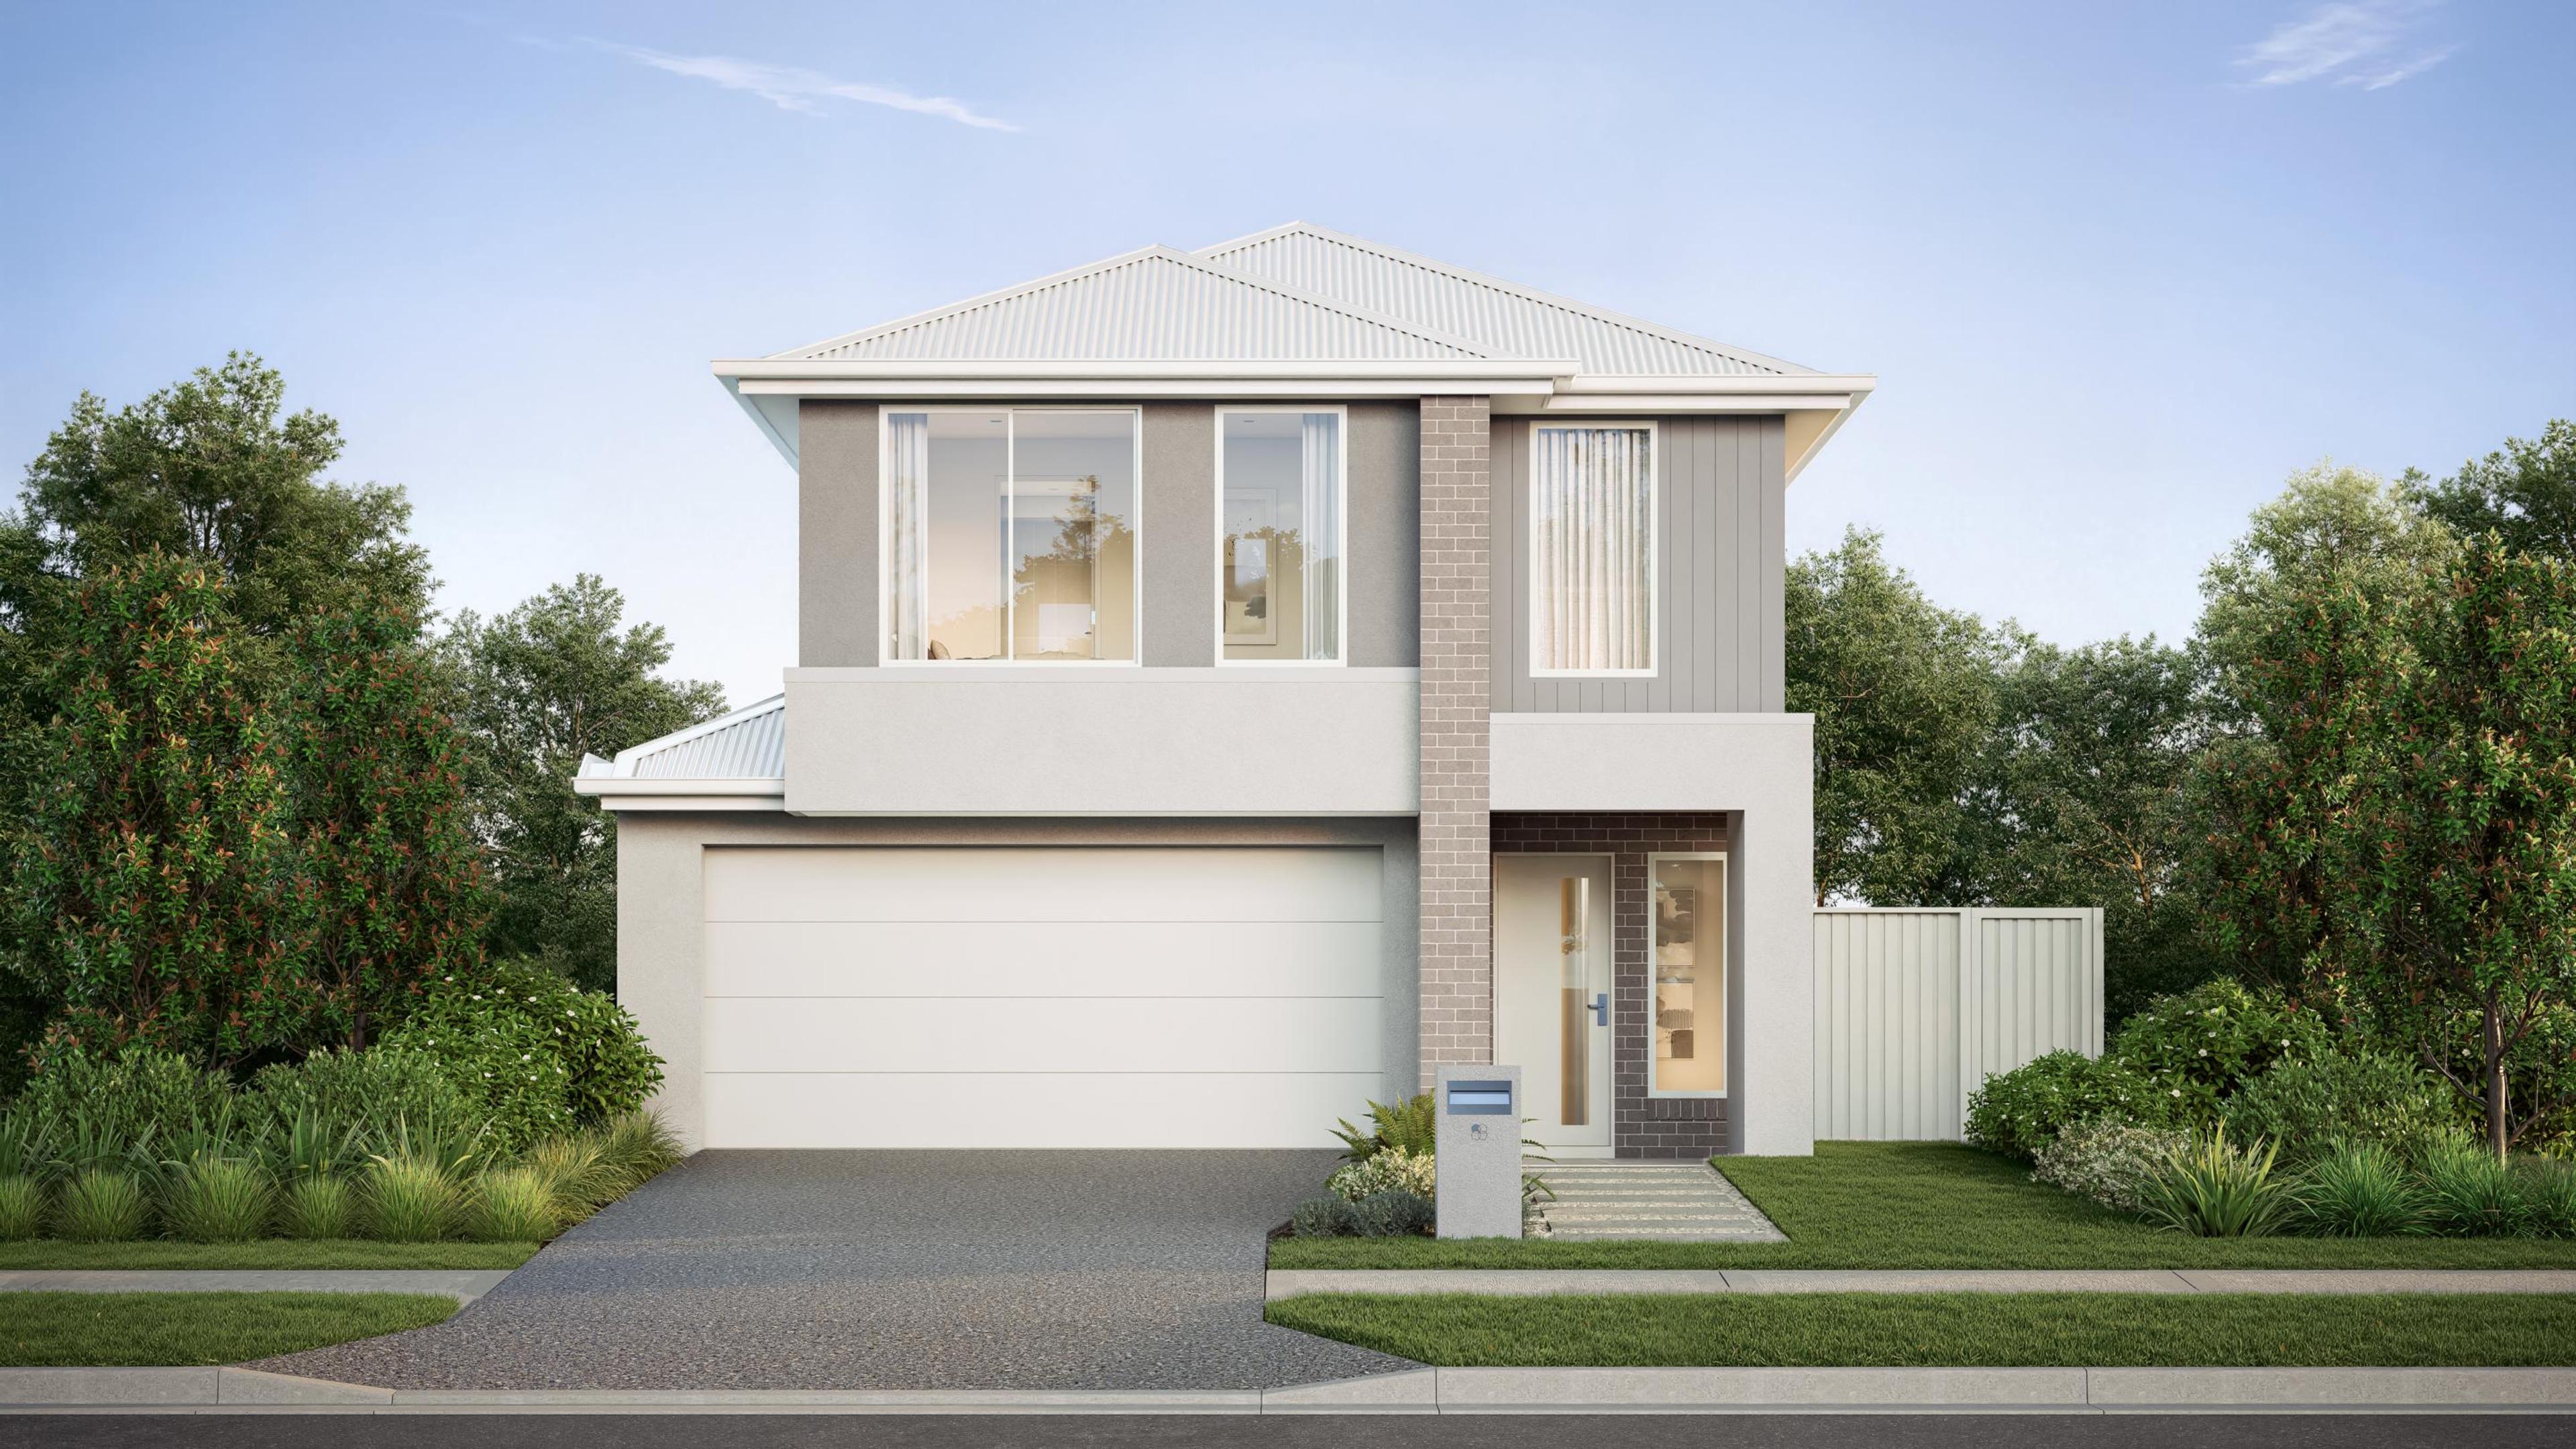
SUBURB GC
3 min read
23 Oct 2026
Novella Waters Coomera Review & Guide
Read Article
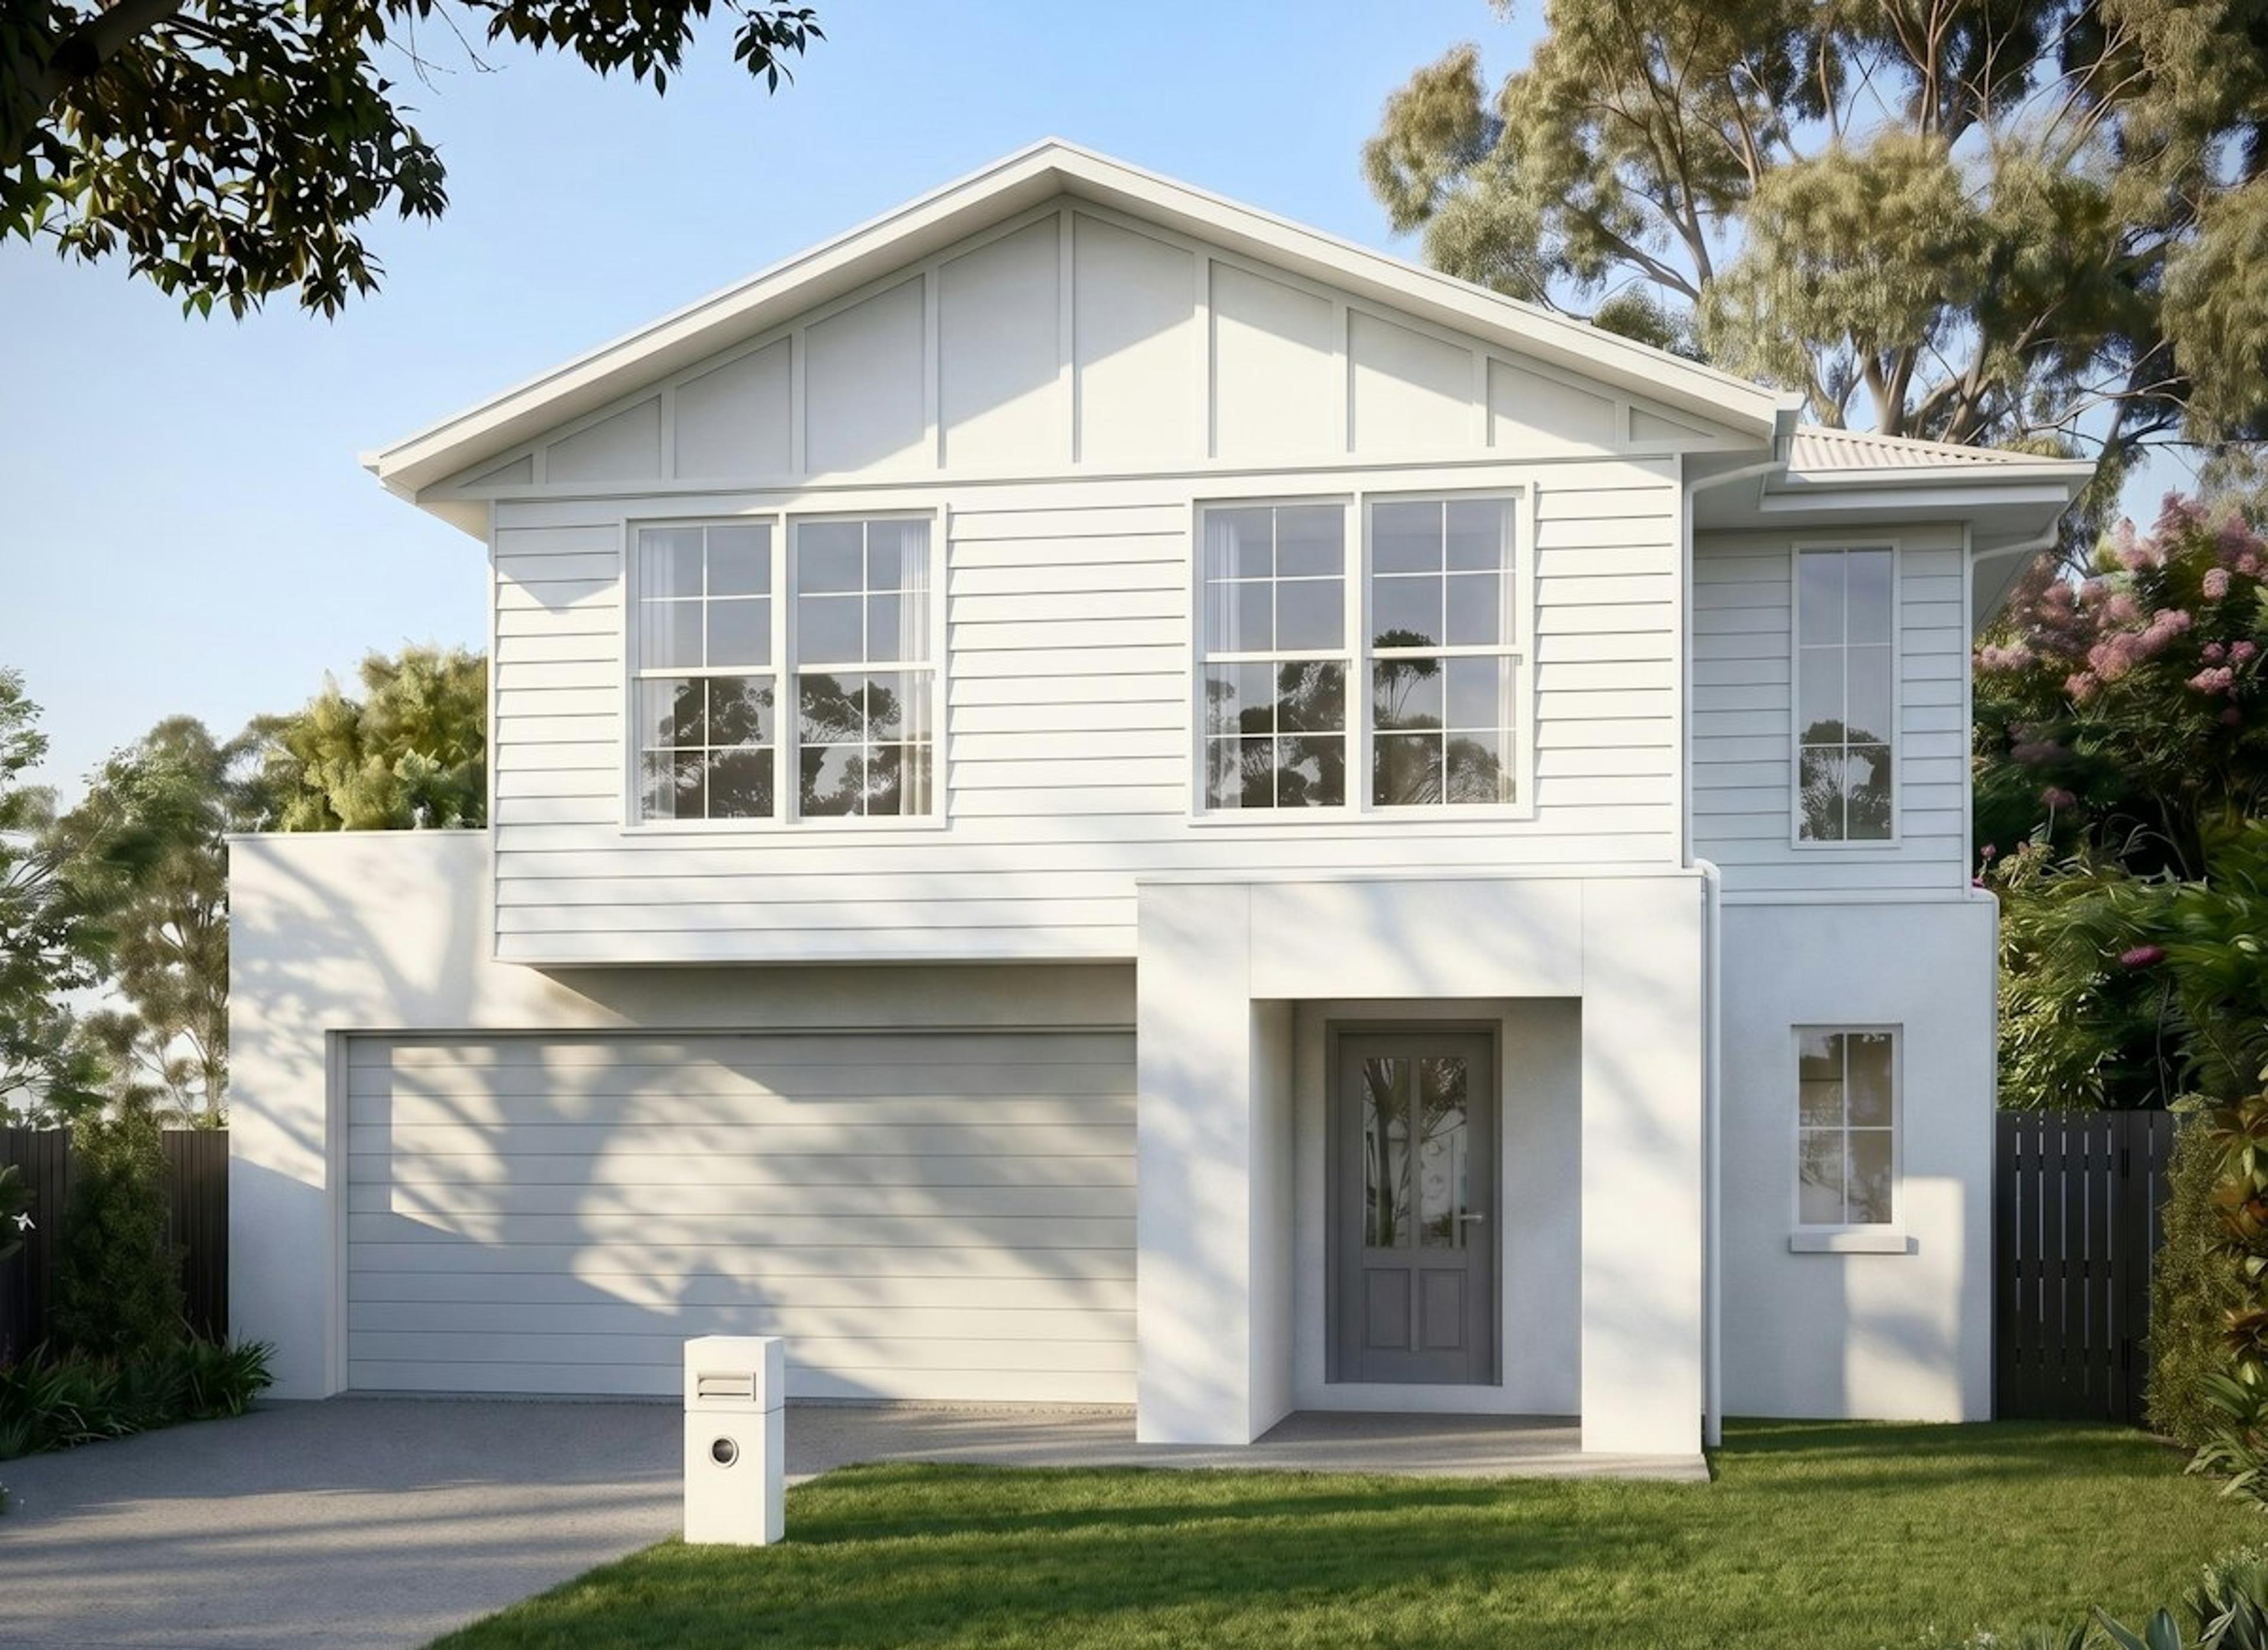
SUBURB GC
3 min read
23 Oct 2026
Ironbark Pimpama Review & Buyer Guide
Read Article
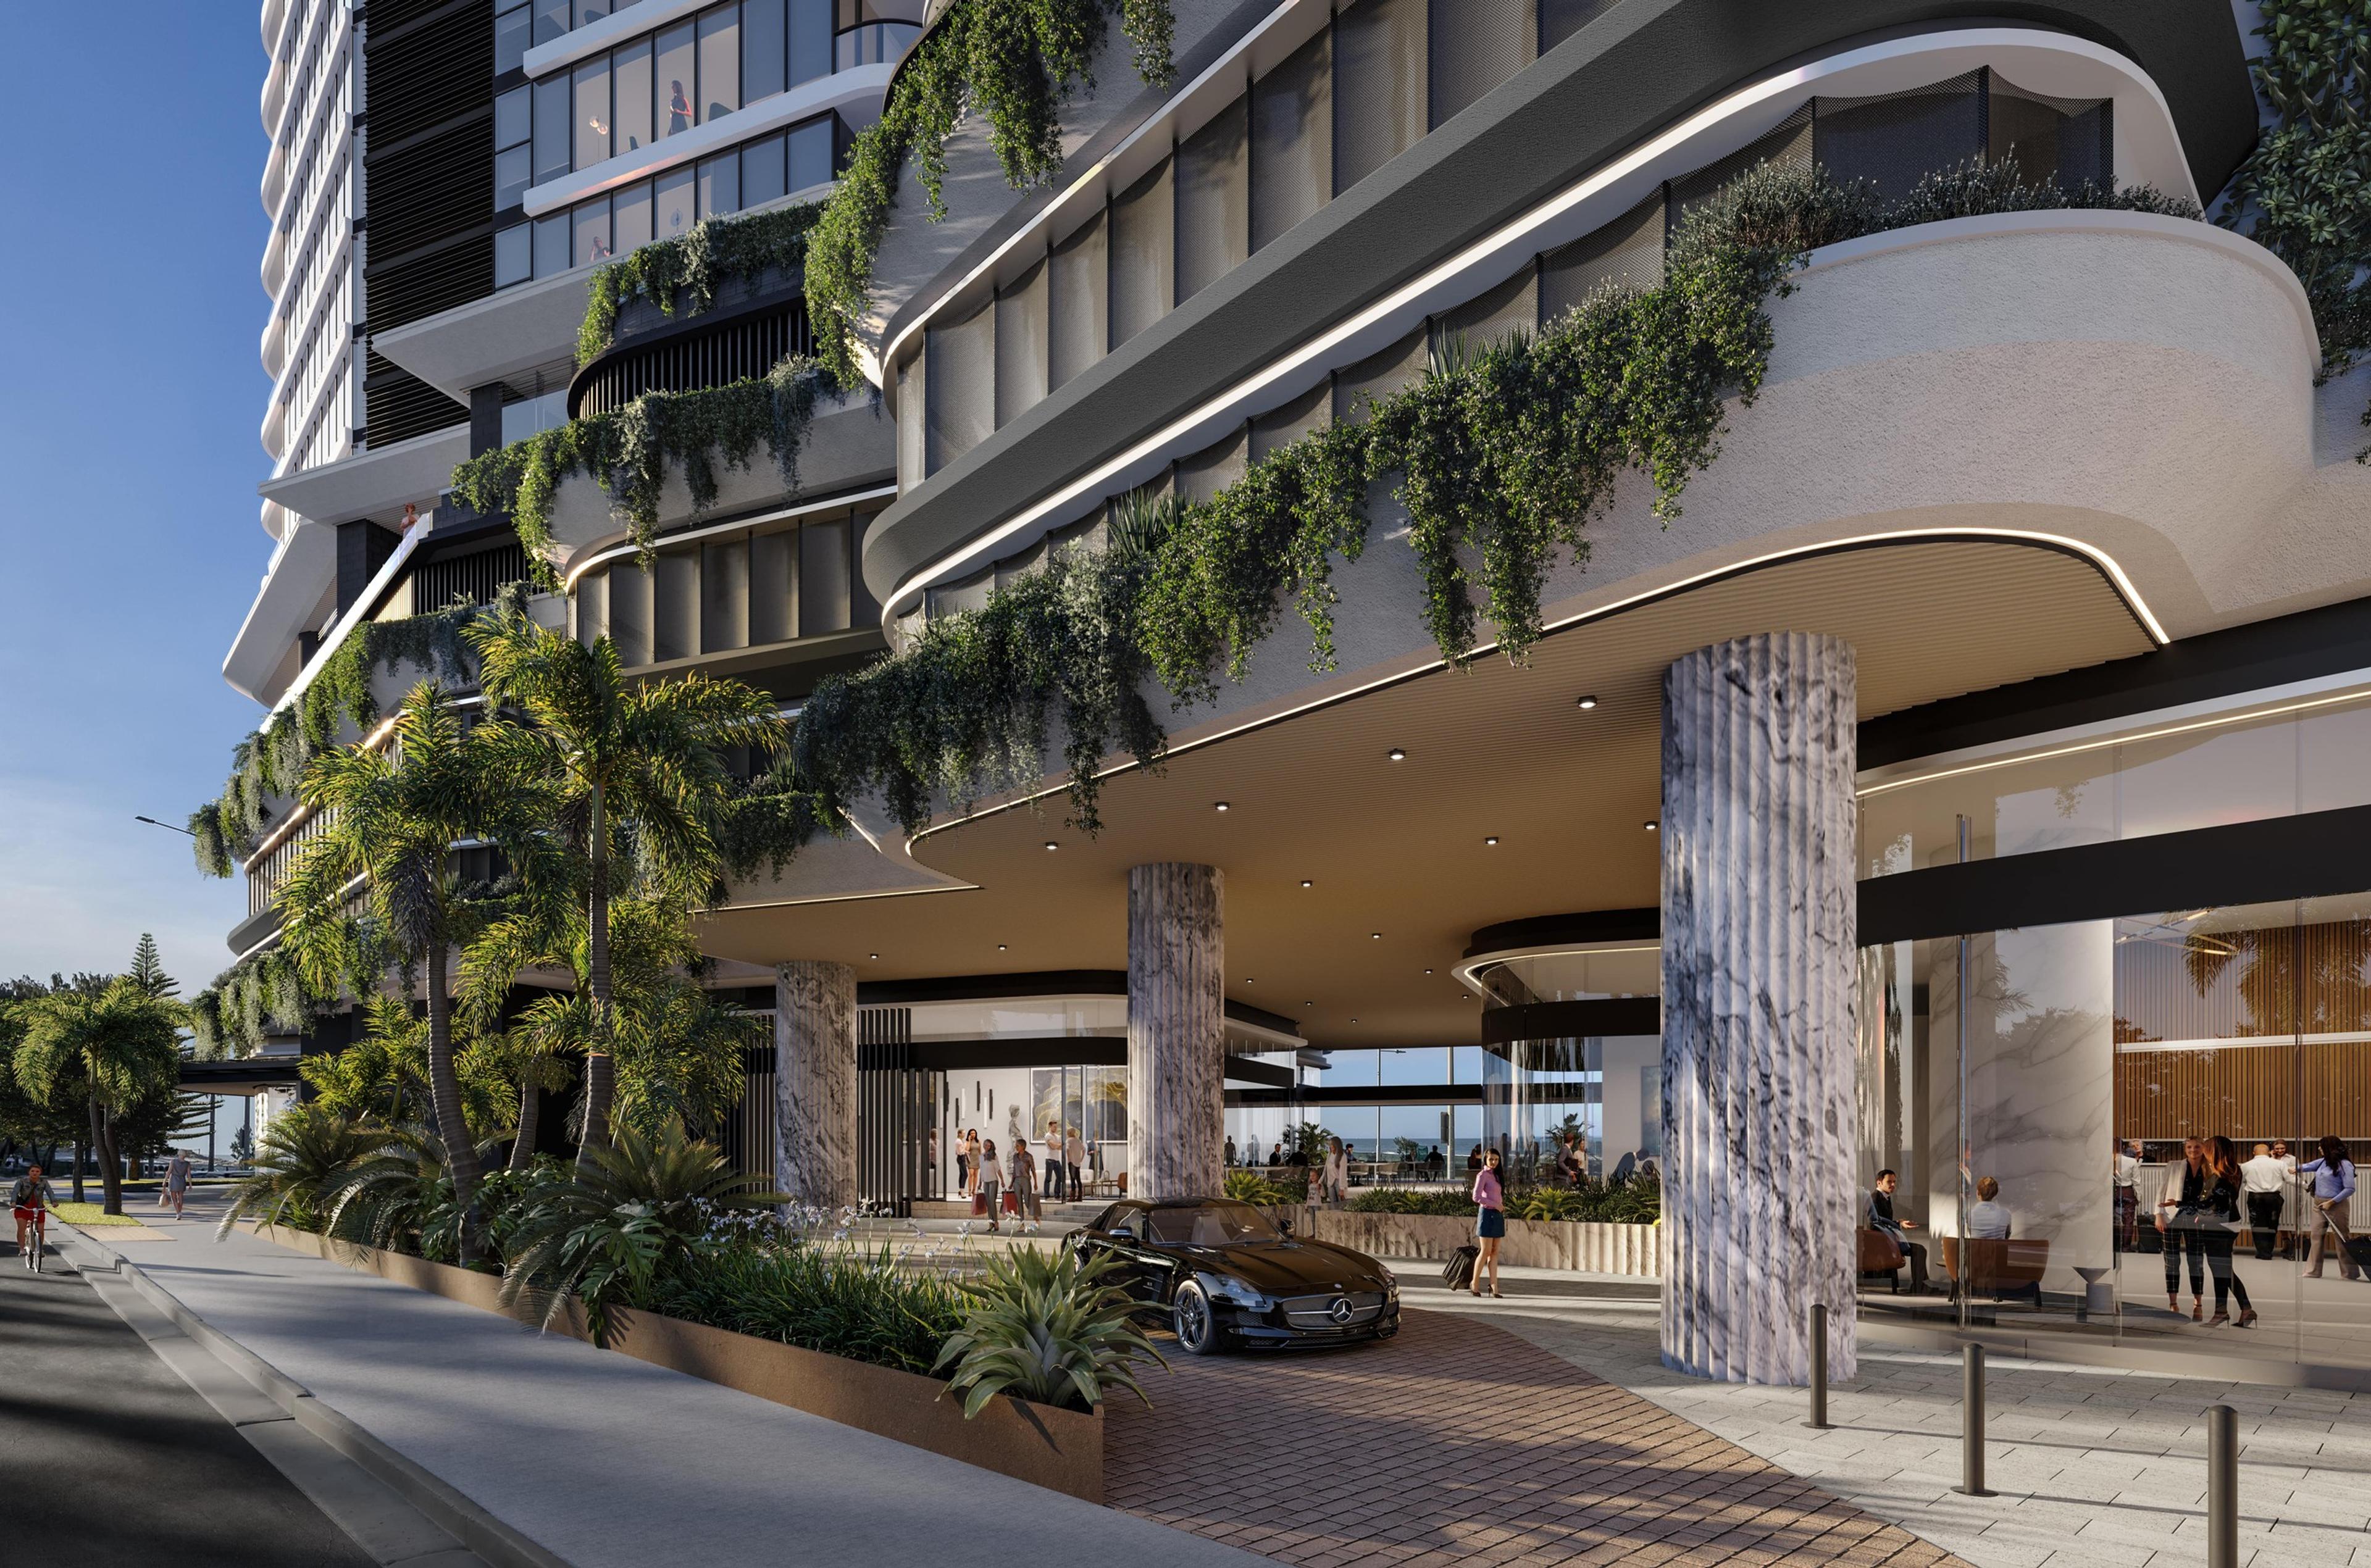
SUBURB GC
3 min read
21 Oct 2026
Upper Coomera vs Pimpama: Gold Coast
Read Article
MARKET DATA
3 min read
15 Sept 2026
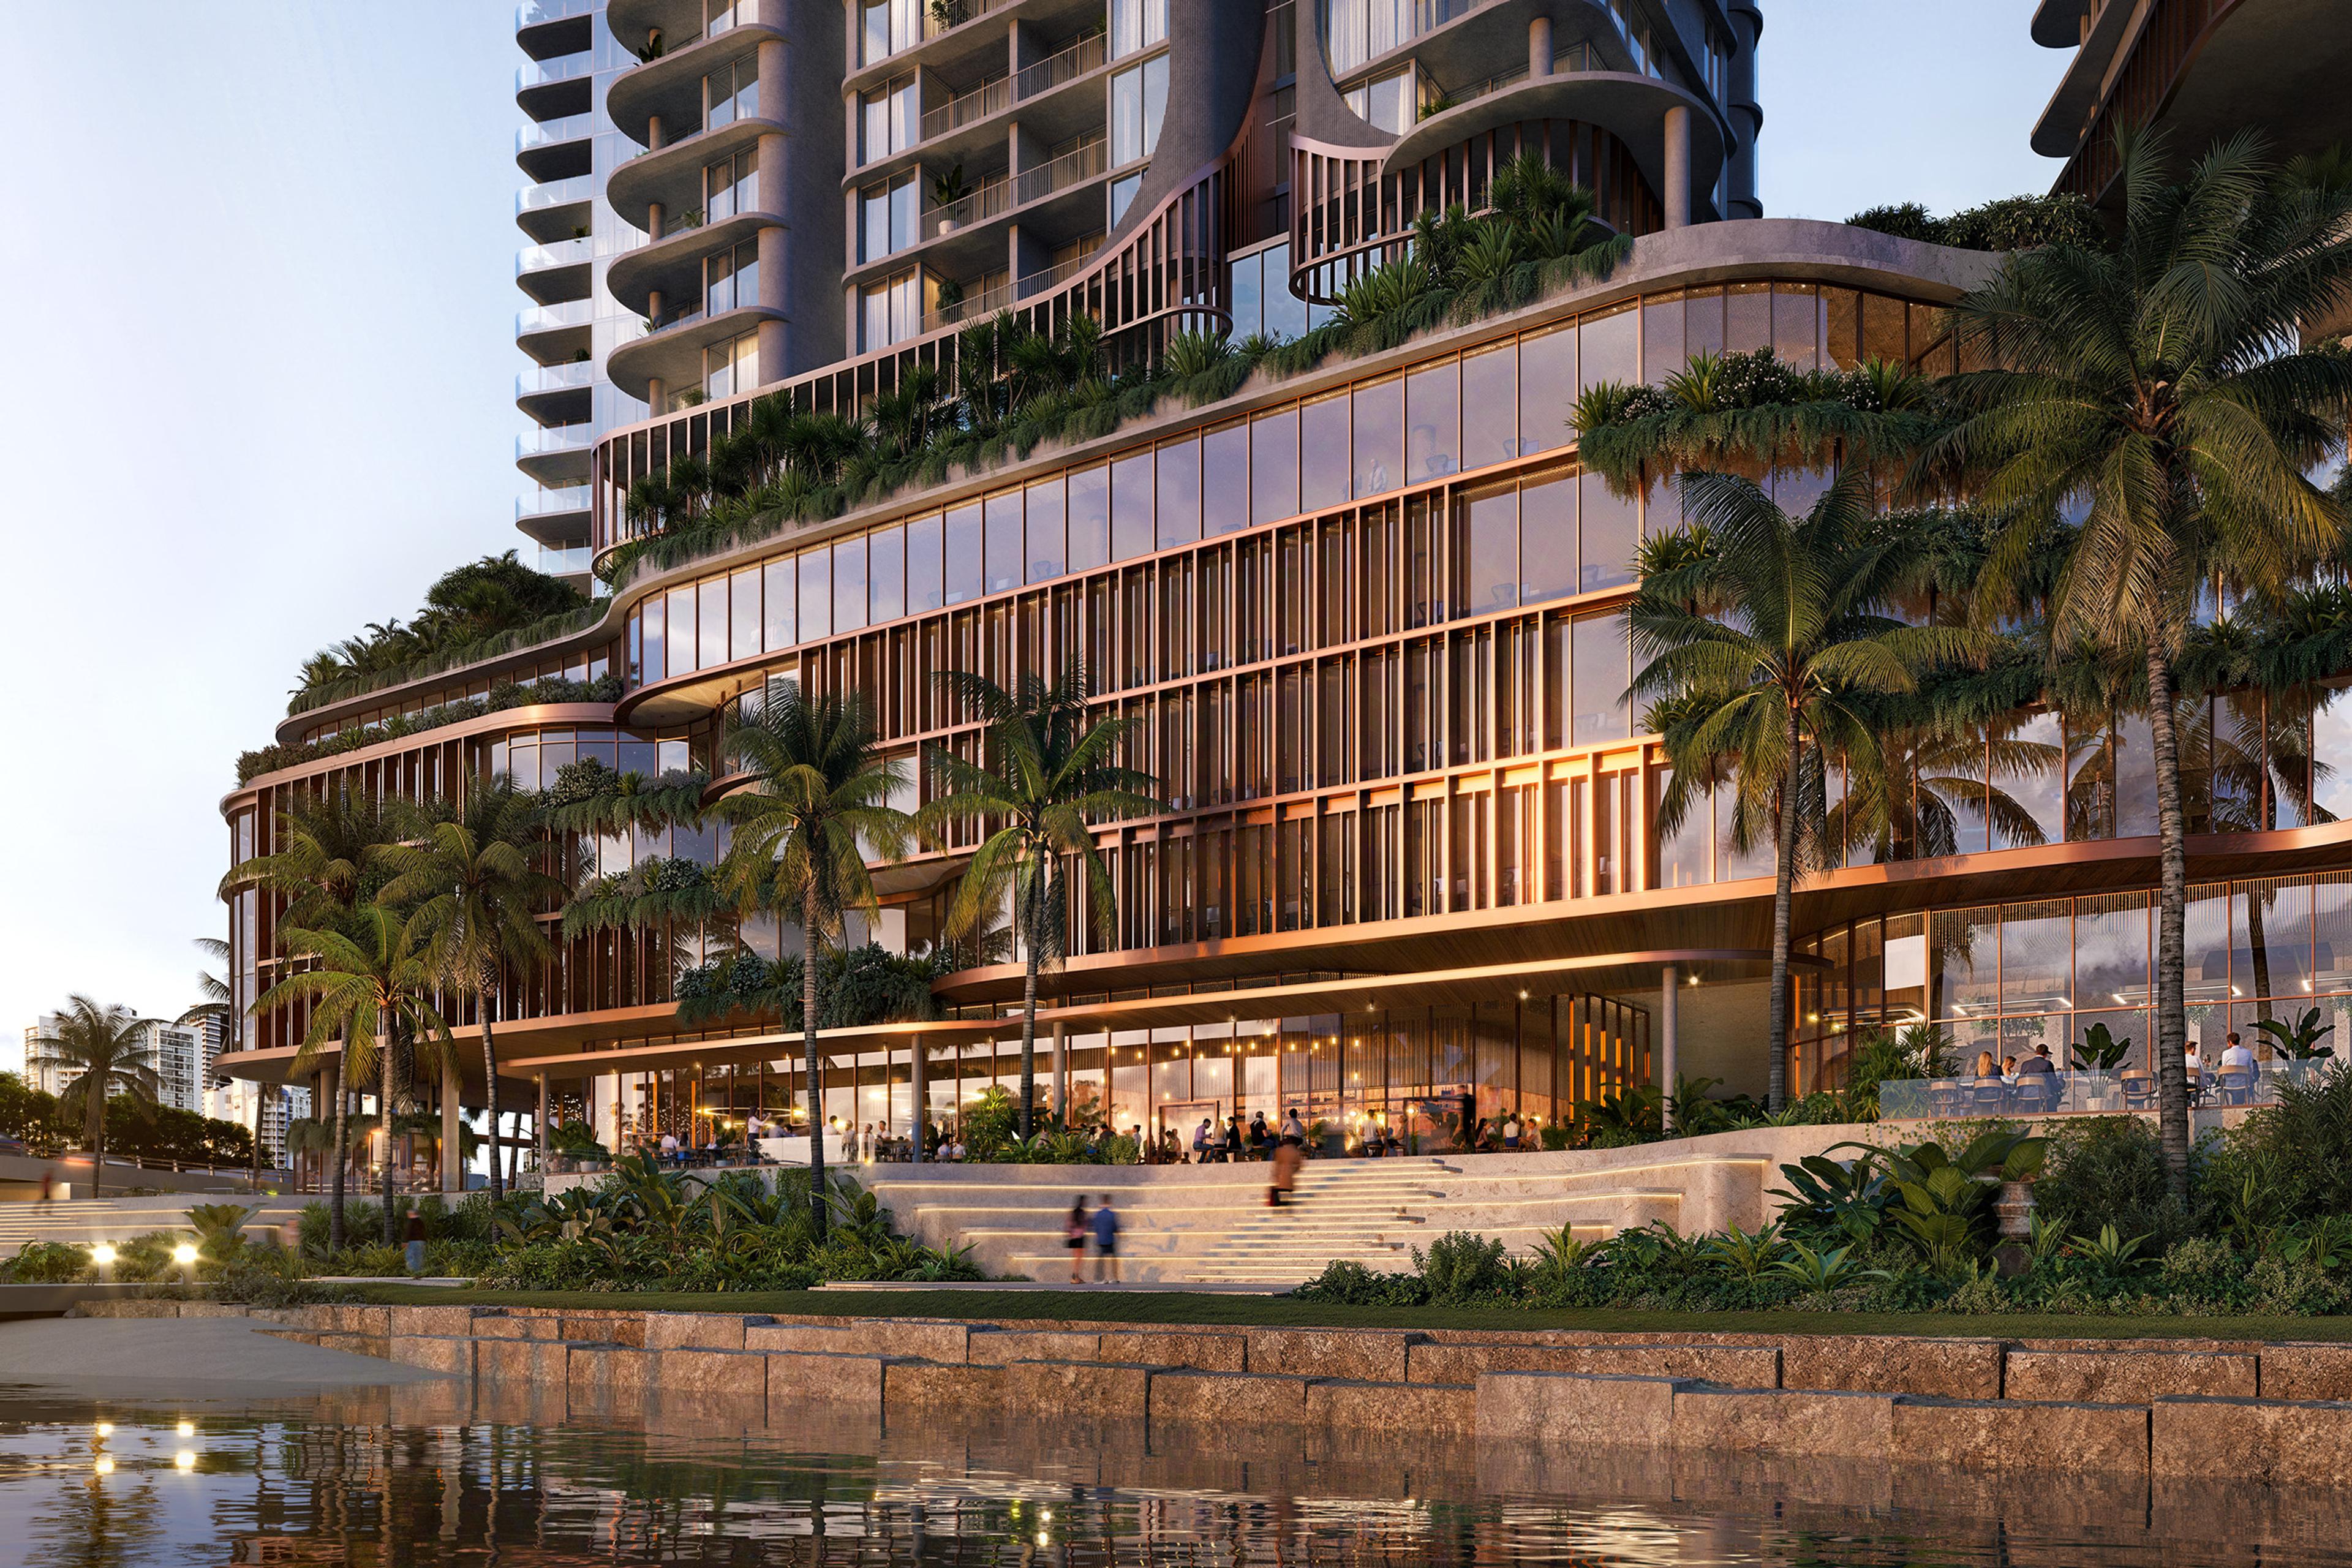
Gold Coast Property Forecast 2026 Guide
Read Article
MARKET DATA
3 min read
13 Sept 2026
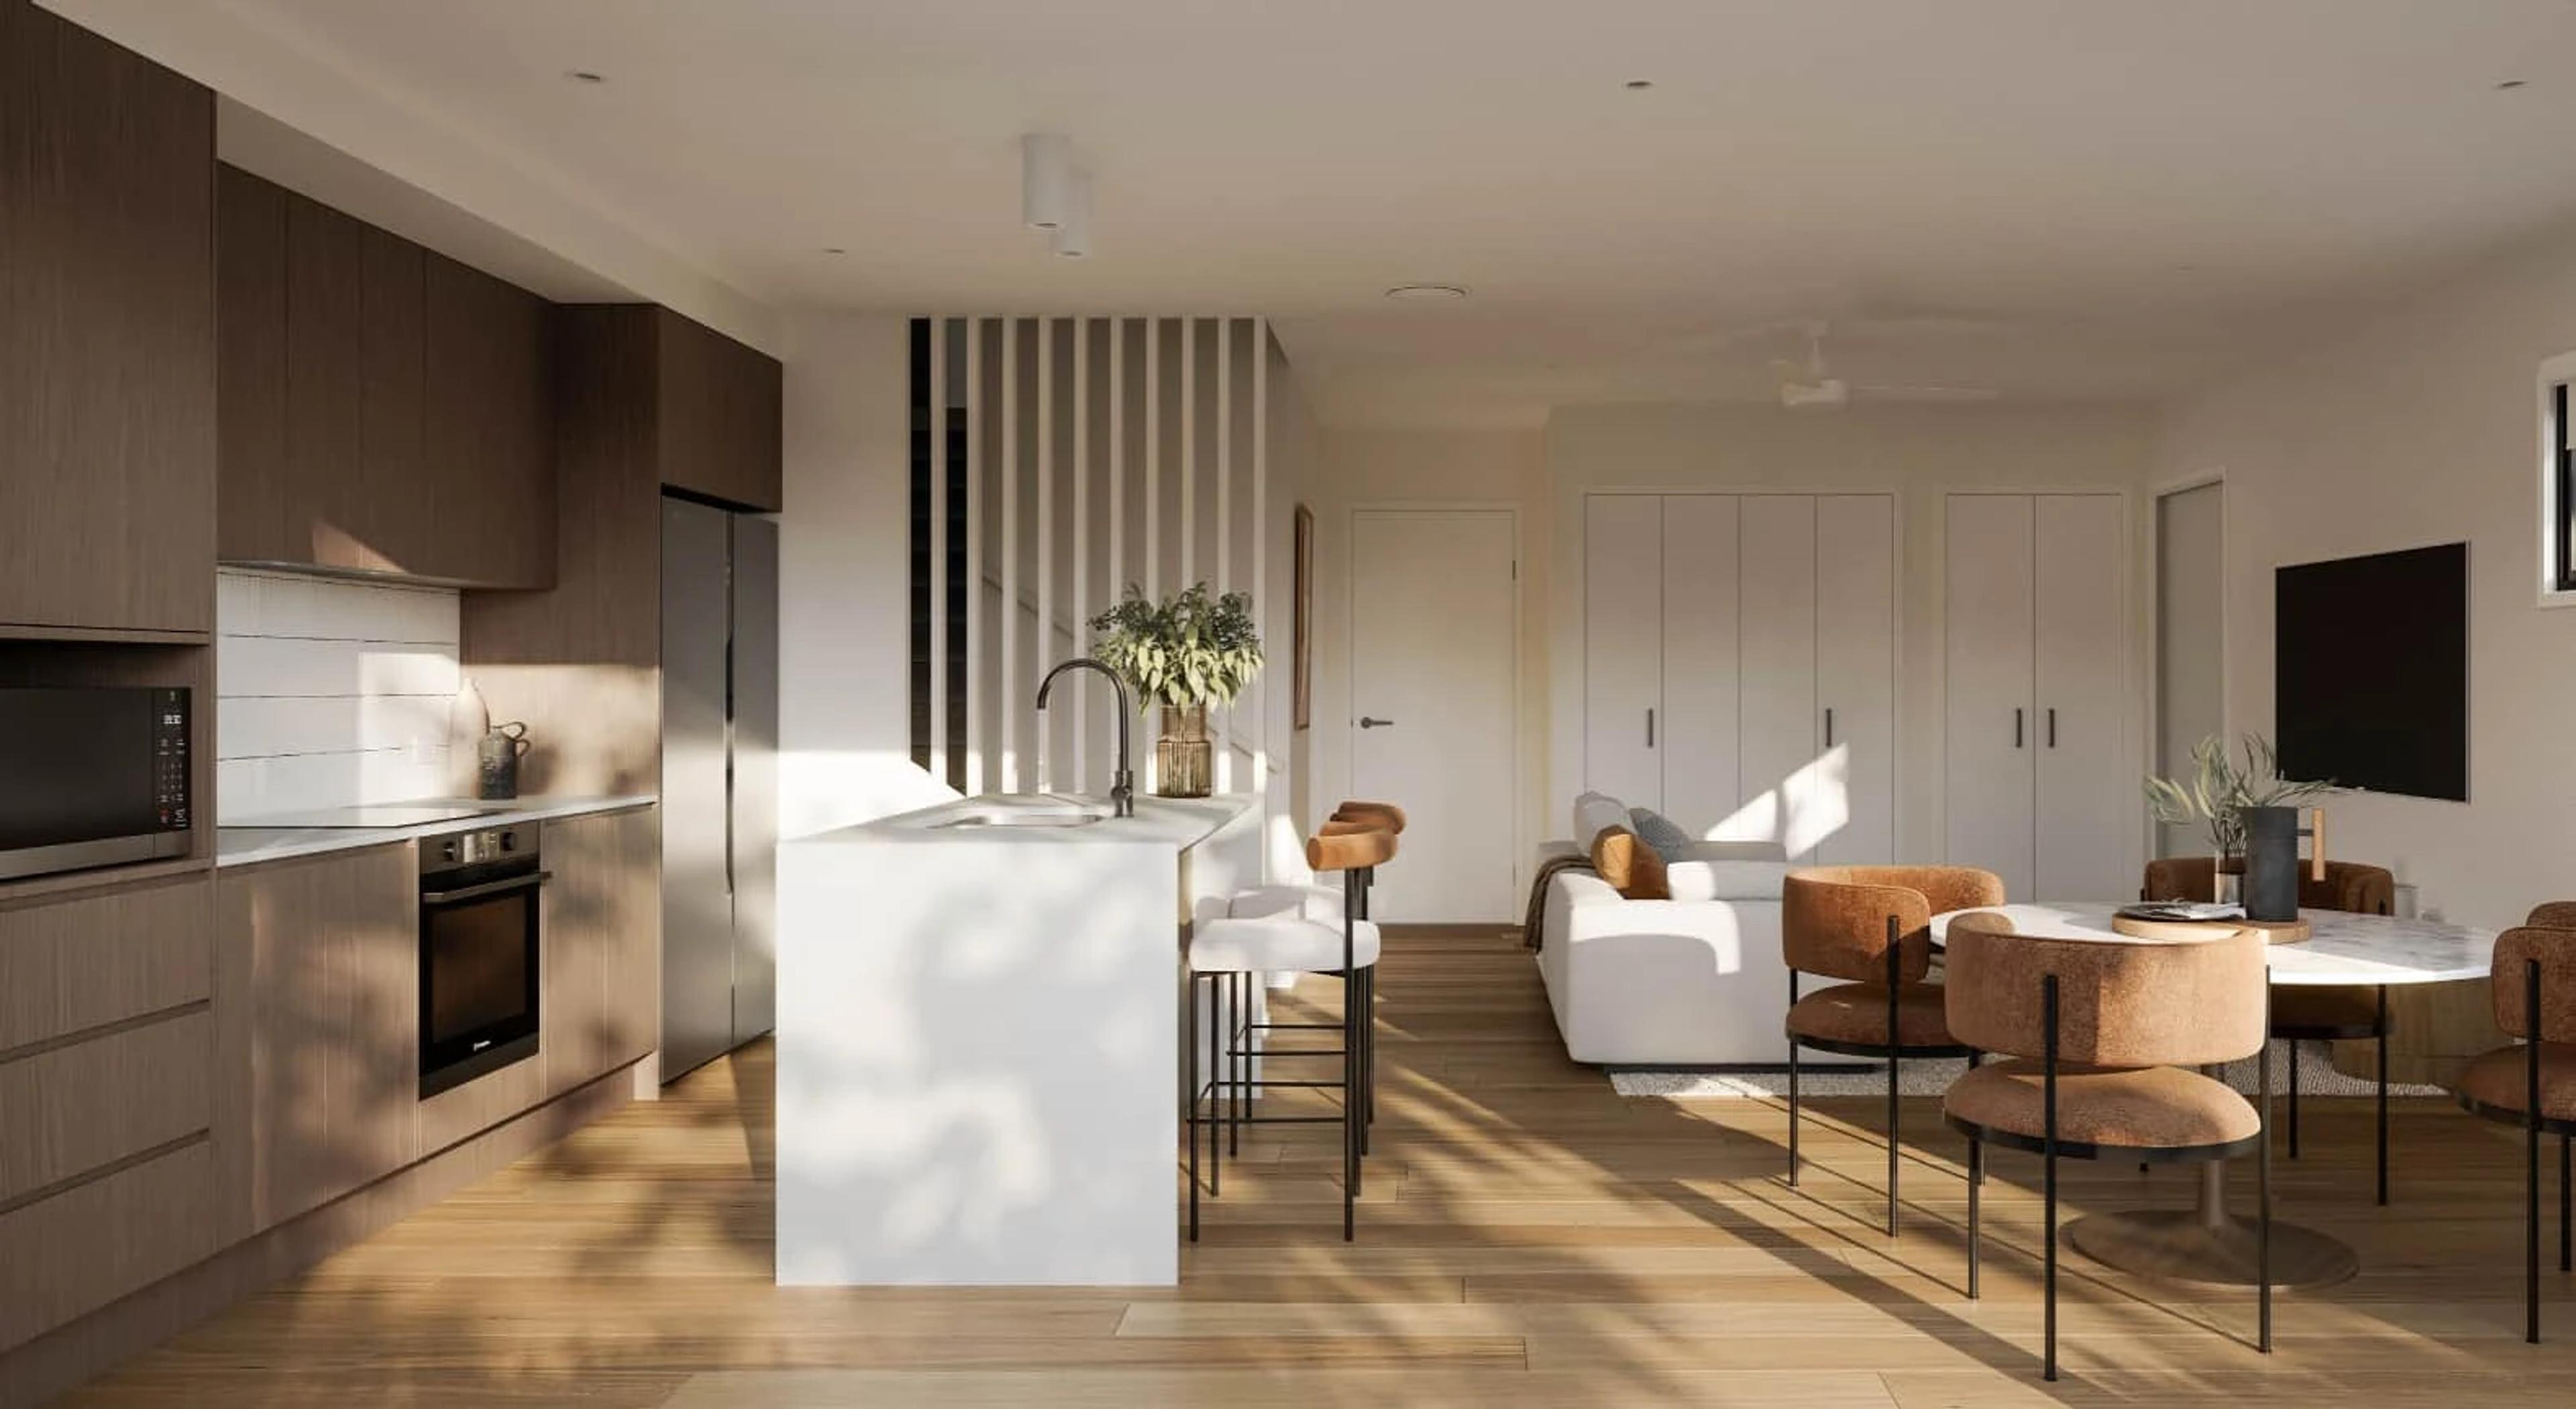
Gold Coast Rental Yields 2026
Read Article
EDUCATION
3 min read
25 Aug 2026
Gold Coast School Catchments 2026
Read Article
FUTURE
3 min read
20 Aug 2026
Gold Coast Coastal Hazard Management
Read Article
Market Intelligence & Buyer Guidelines
Frequently Asked Questions about Gold Coast.
Key insights on median pricing, council planning restrictions, gross yields, and off-the-plan acquisitions across the Gold Coast property market.
The Gold Coast property market is insulated by absolute geographical boundaries between the Pacific Ocean and the Hinterland ranges, which strictly limit developable land. Sustained interstate migration, multi-billion-dollar infrastructure investments, and a permanent shift toward owner-occupier prestige living create deep, enduring demand that outpaces available supply.