Sydney.
Australia's financial capital pairs iconic harbour geography with strict land scarcity, delivering enduring security and prestige for prime residential property.
Off-Market & In-Planning Corridor
Enquire on Off-Market Stock →Residences in Sydney are currently off-market.
Direct allocations within Sydney are undergoing private release or final architectural approvals. Explore active luxury developments situated nearby, or speak directly with our team for unlisted opportunities.
Featured Developments Near Sydney.
Explore luxury off-the-plan residences actively selling in adjacent corridors near Sydney.
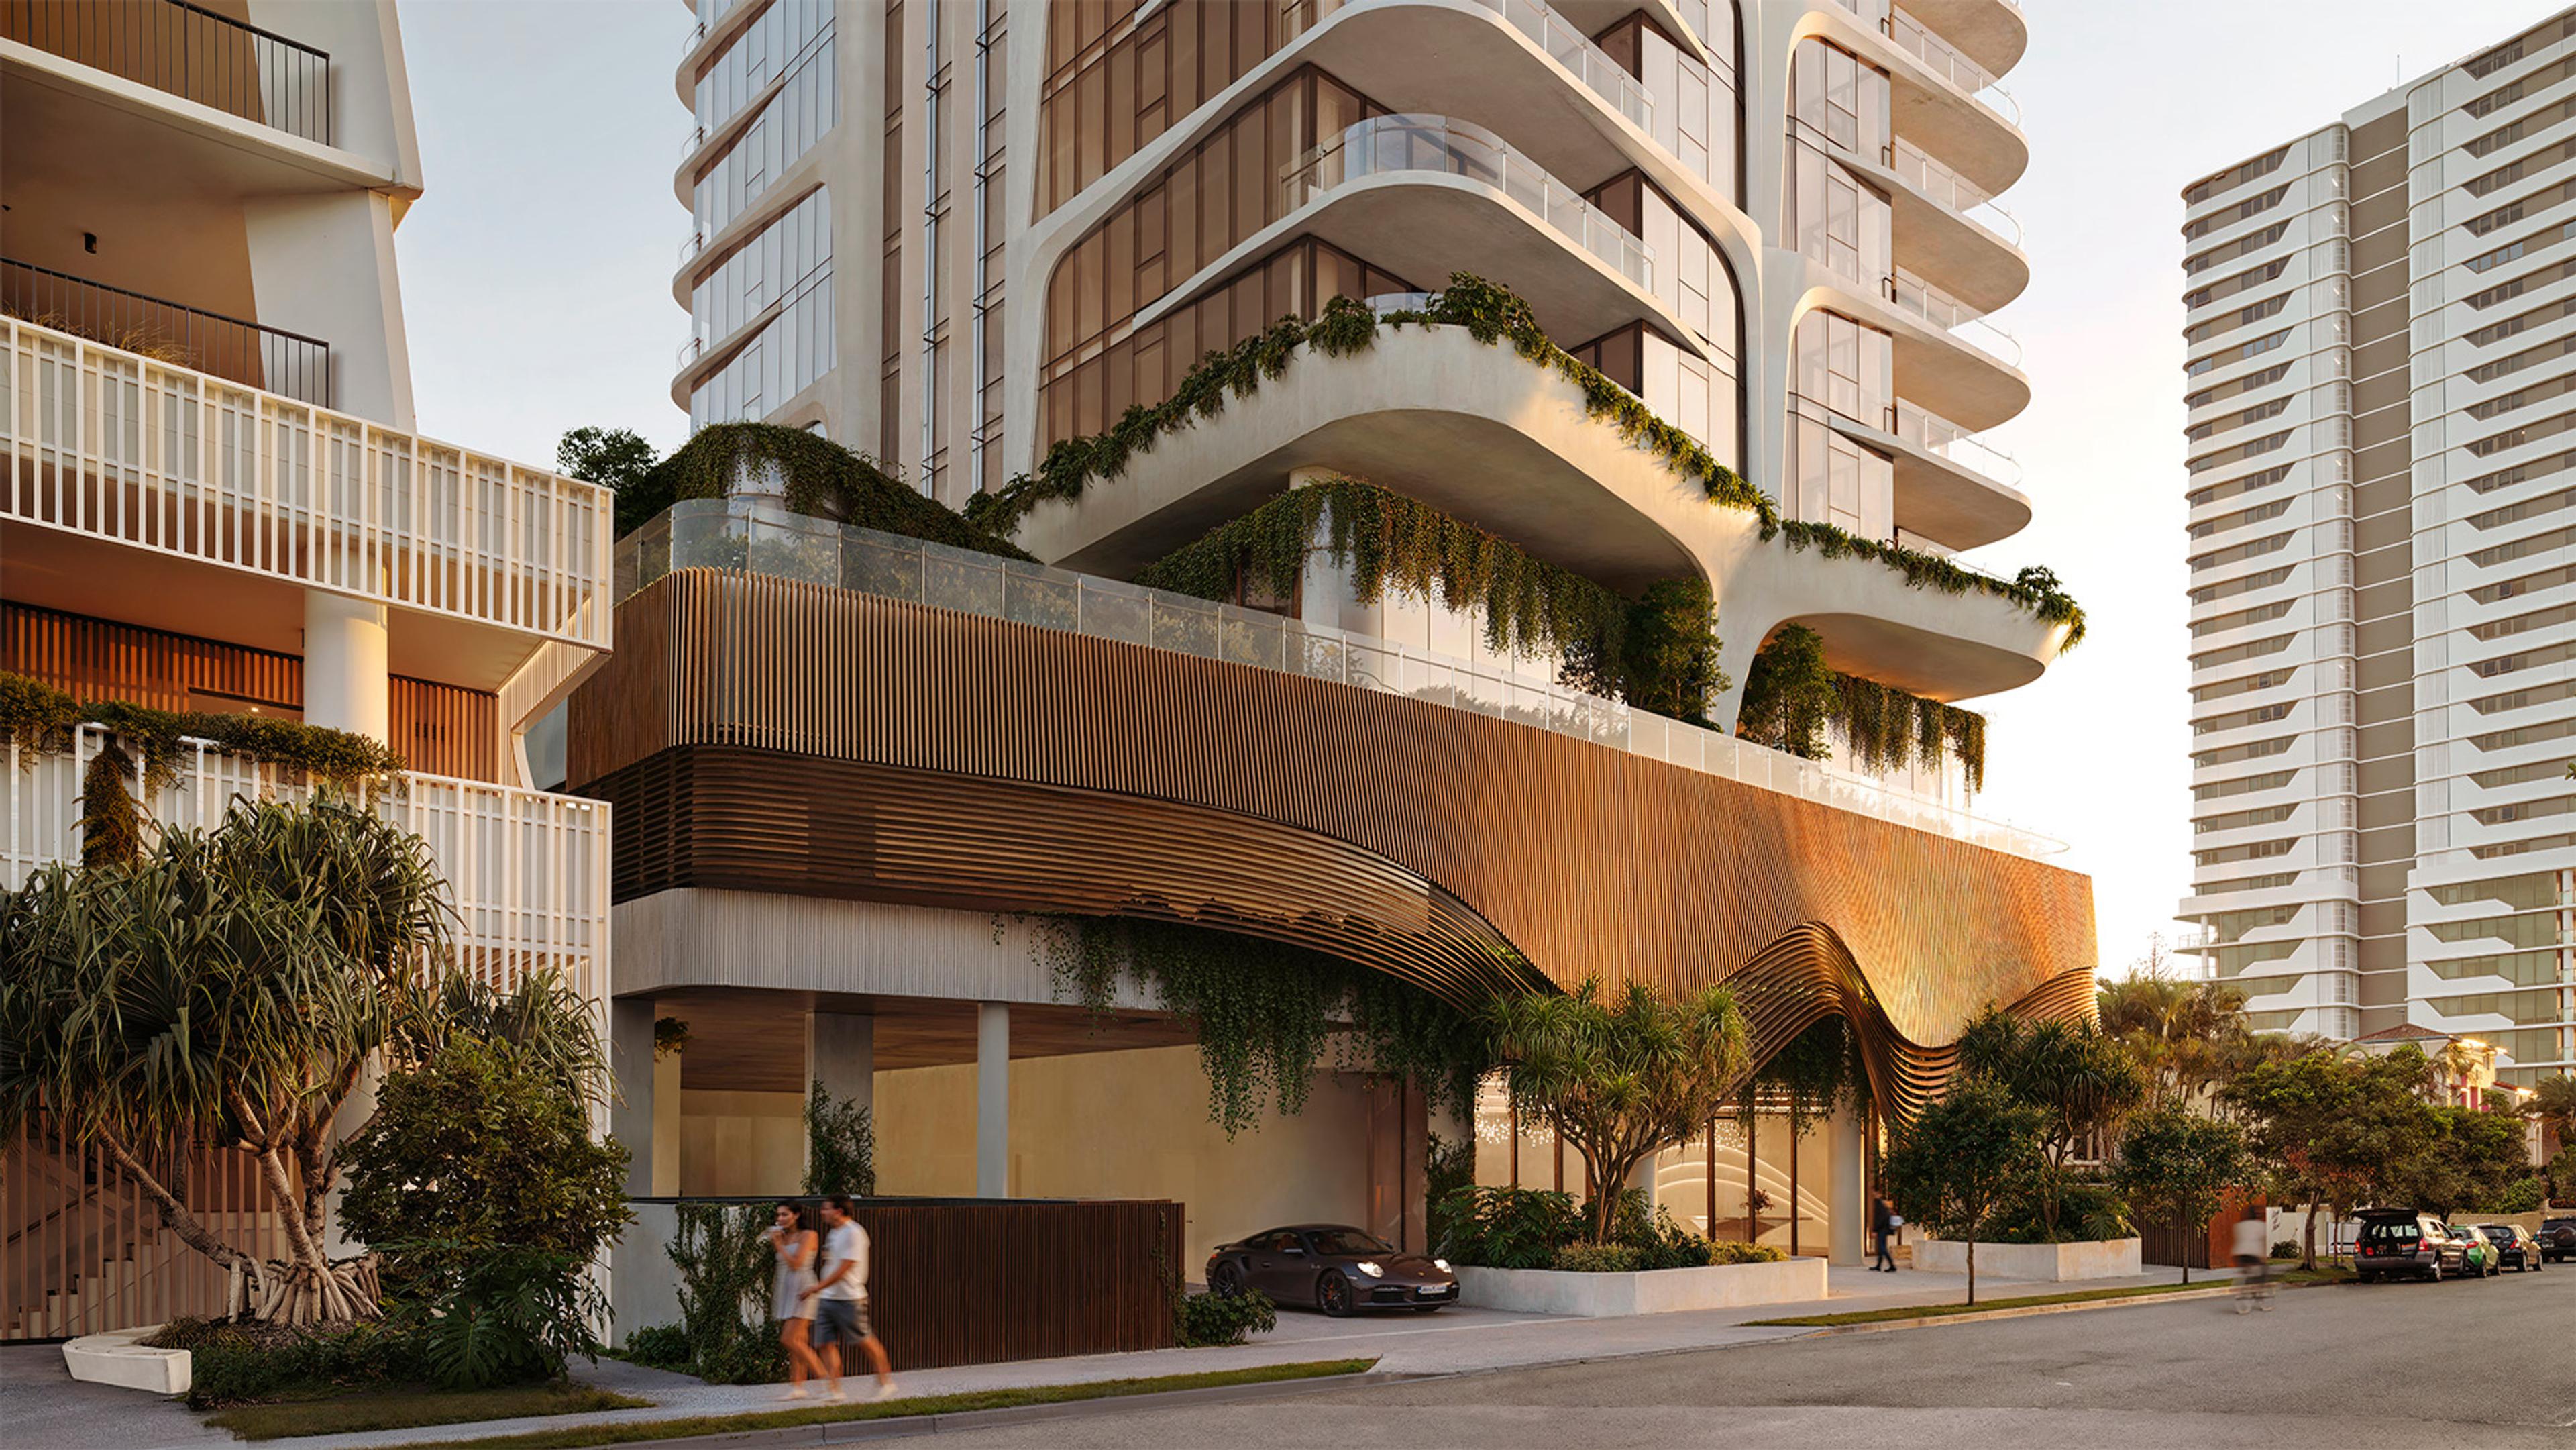
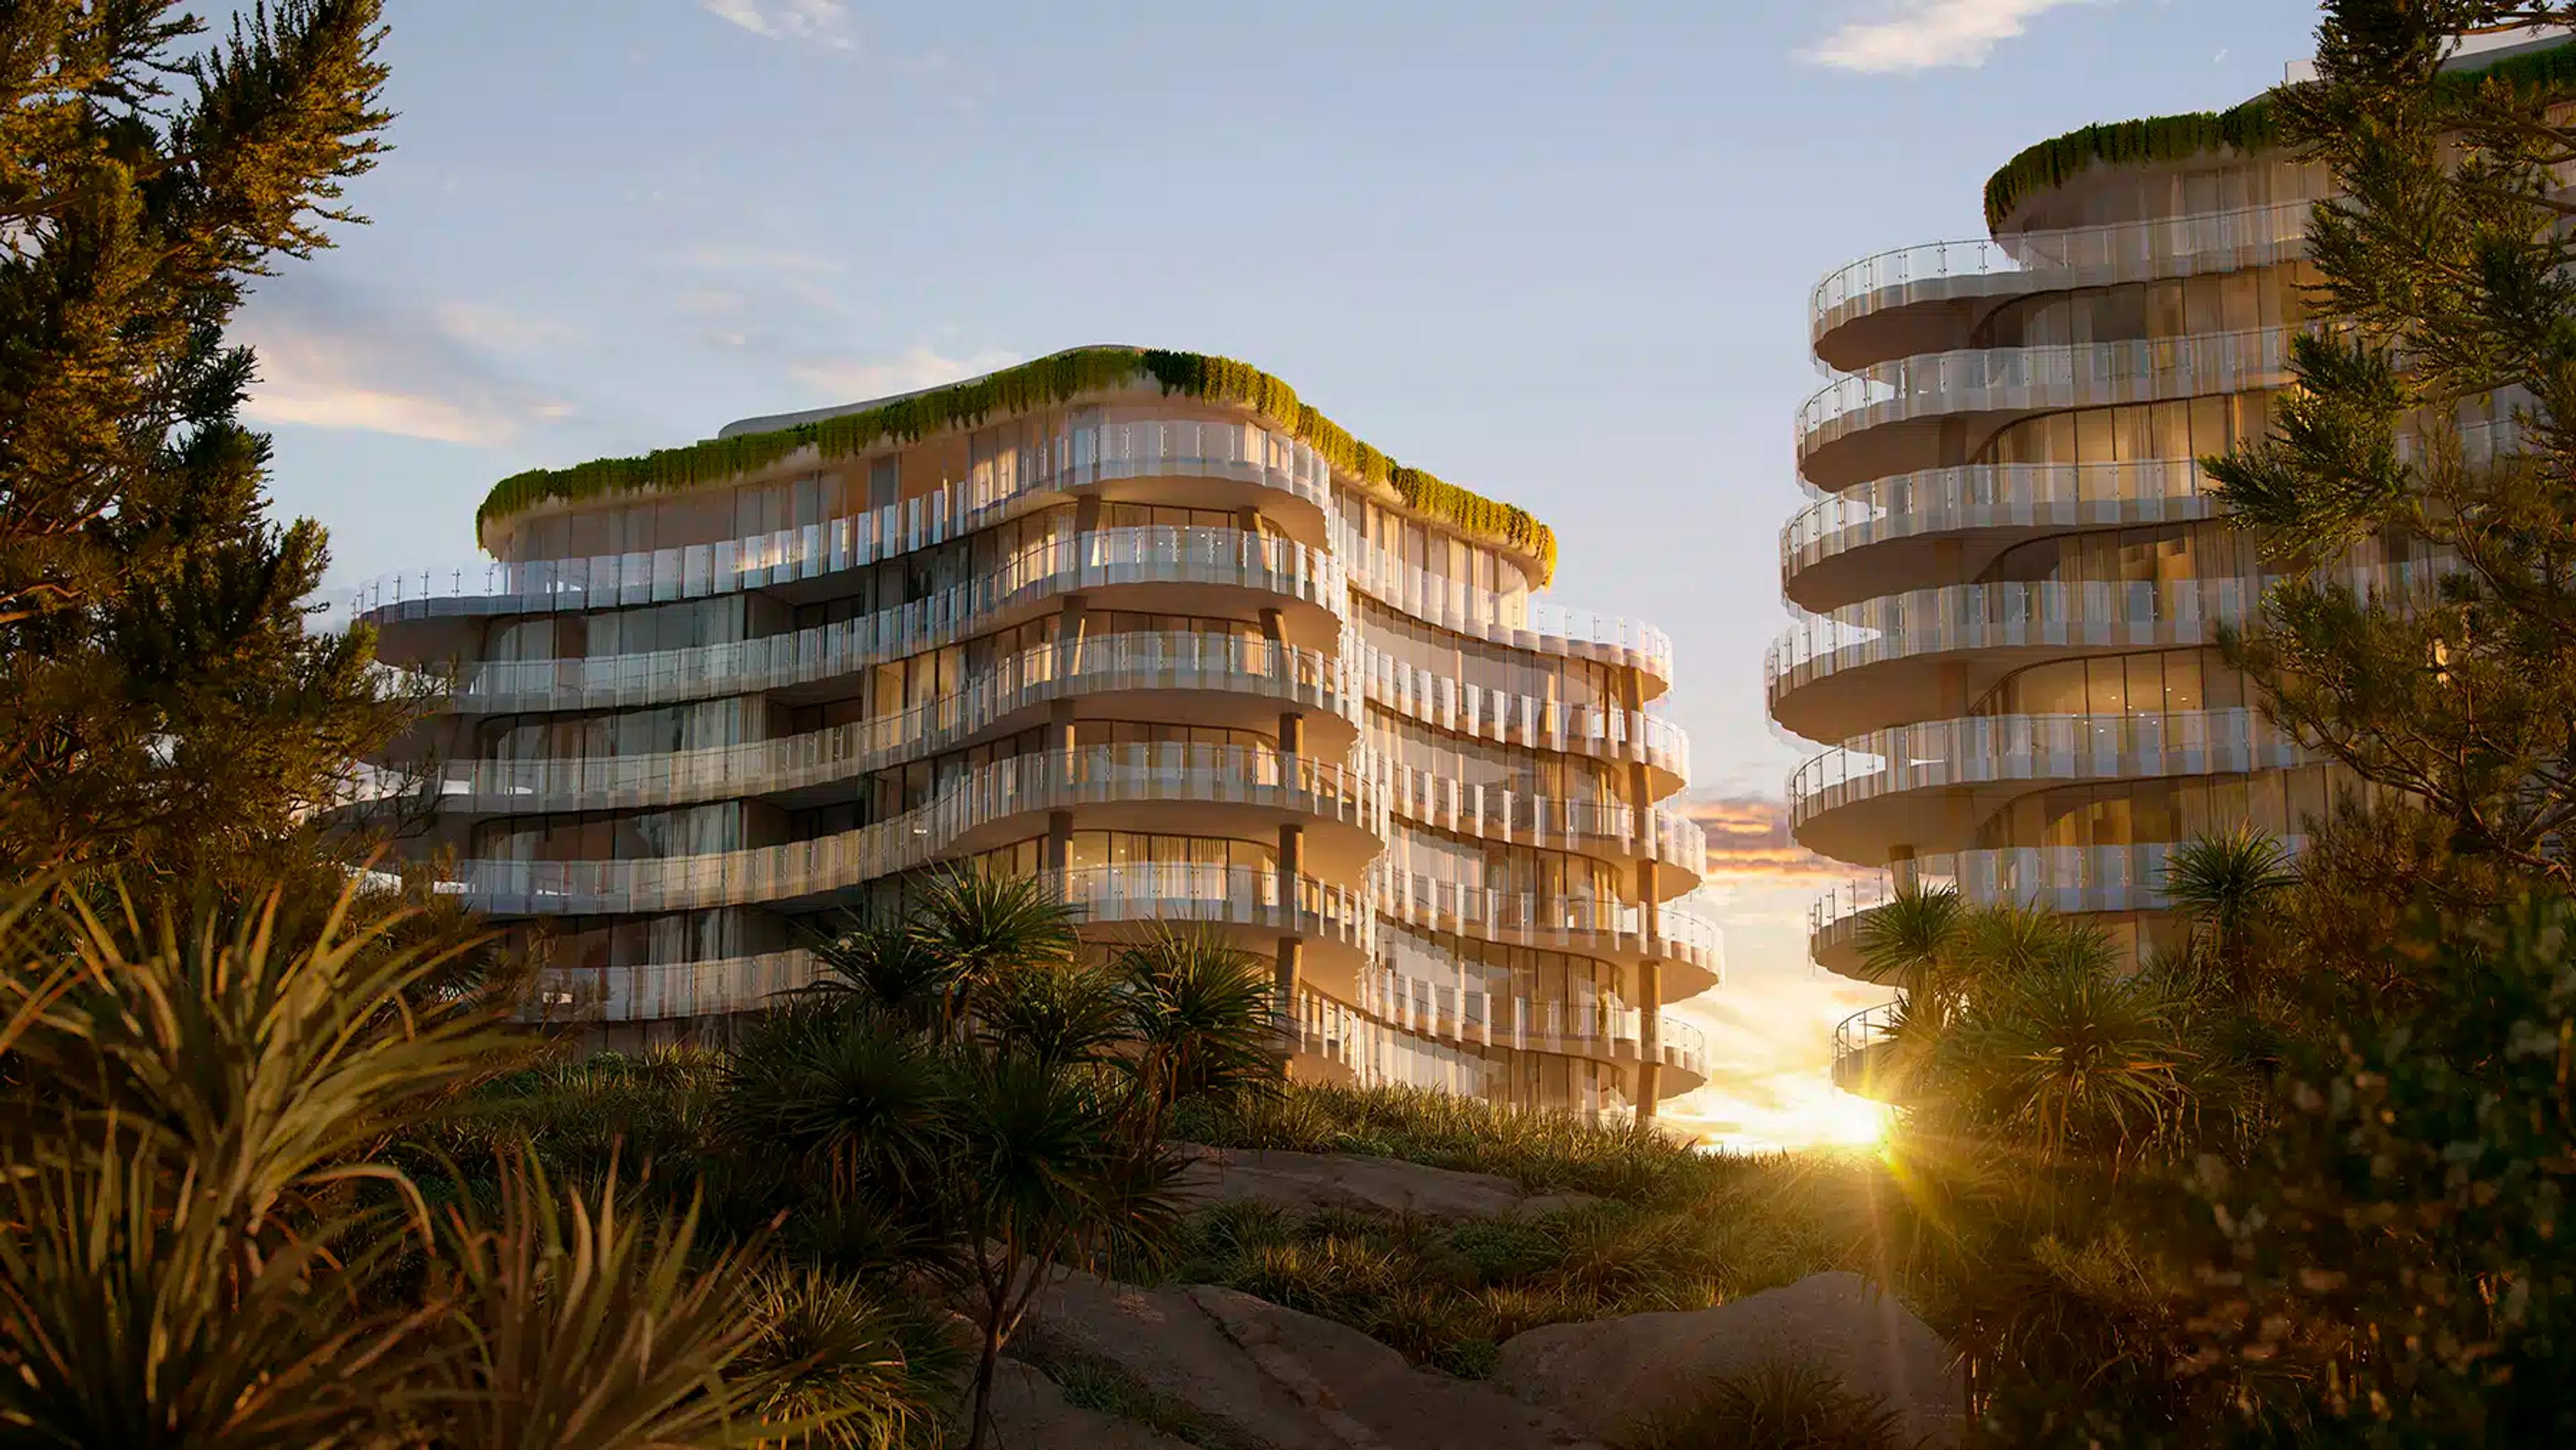
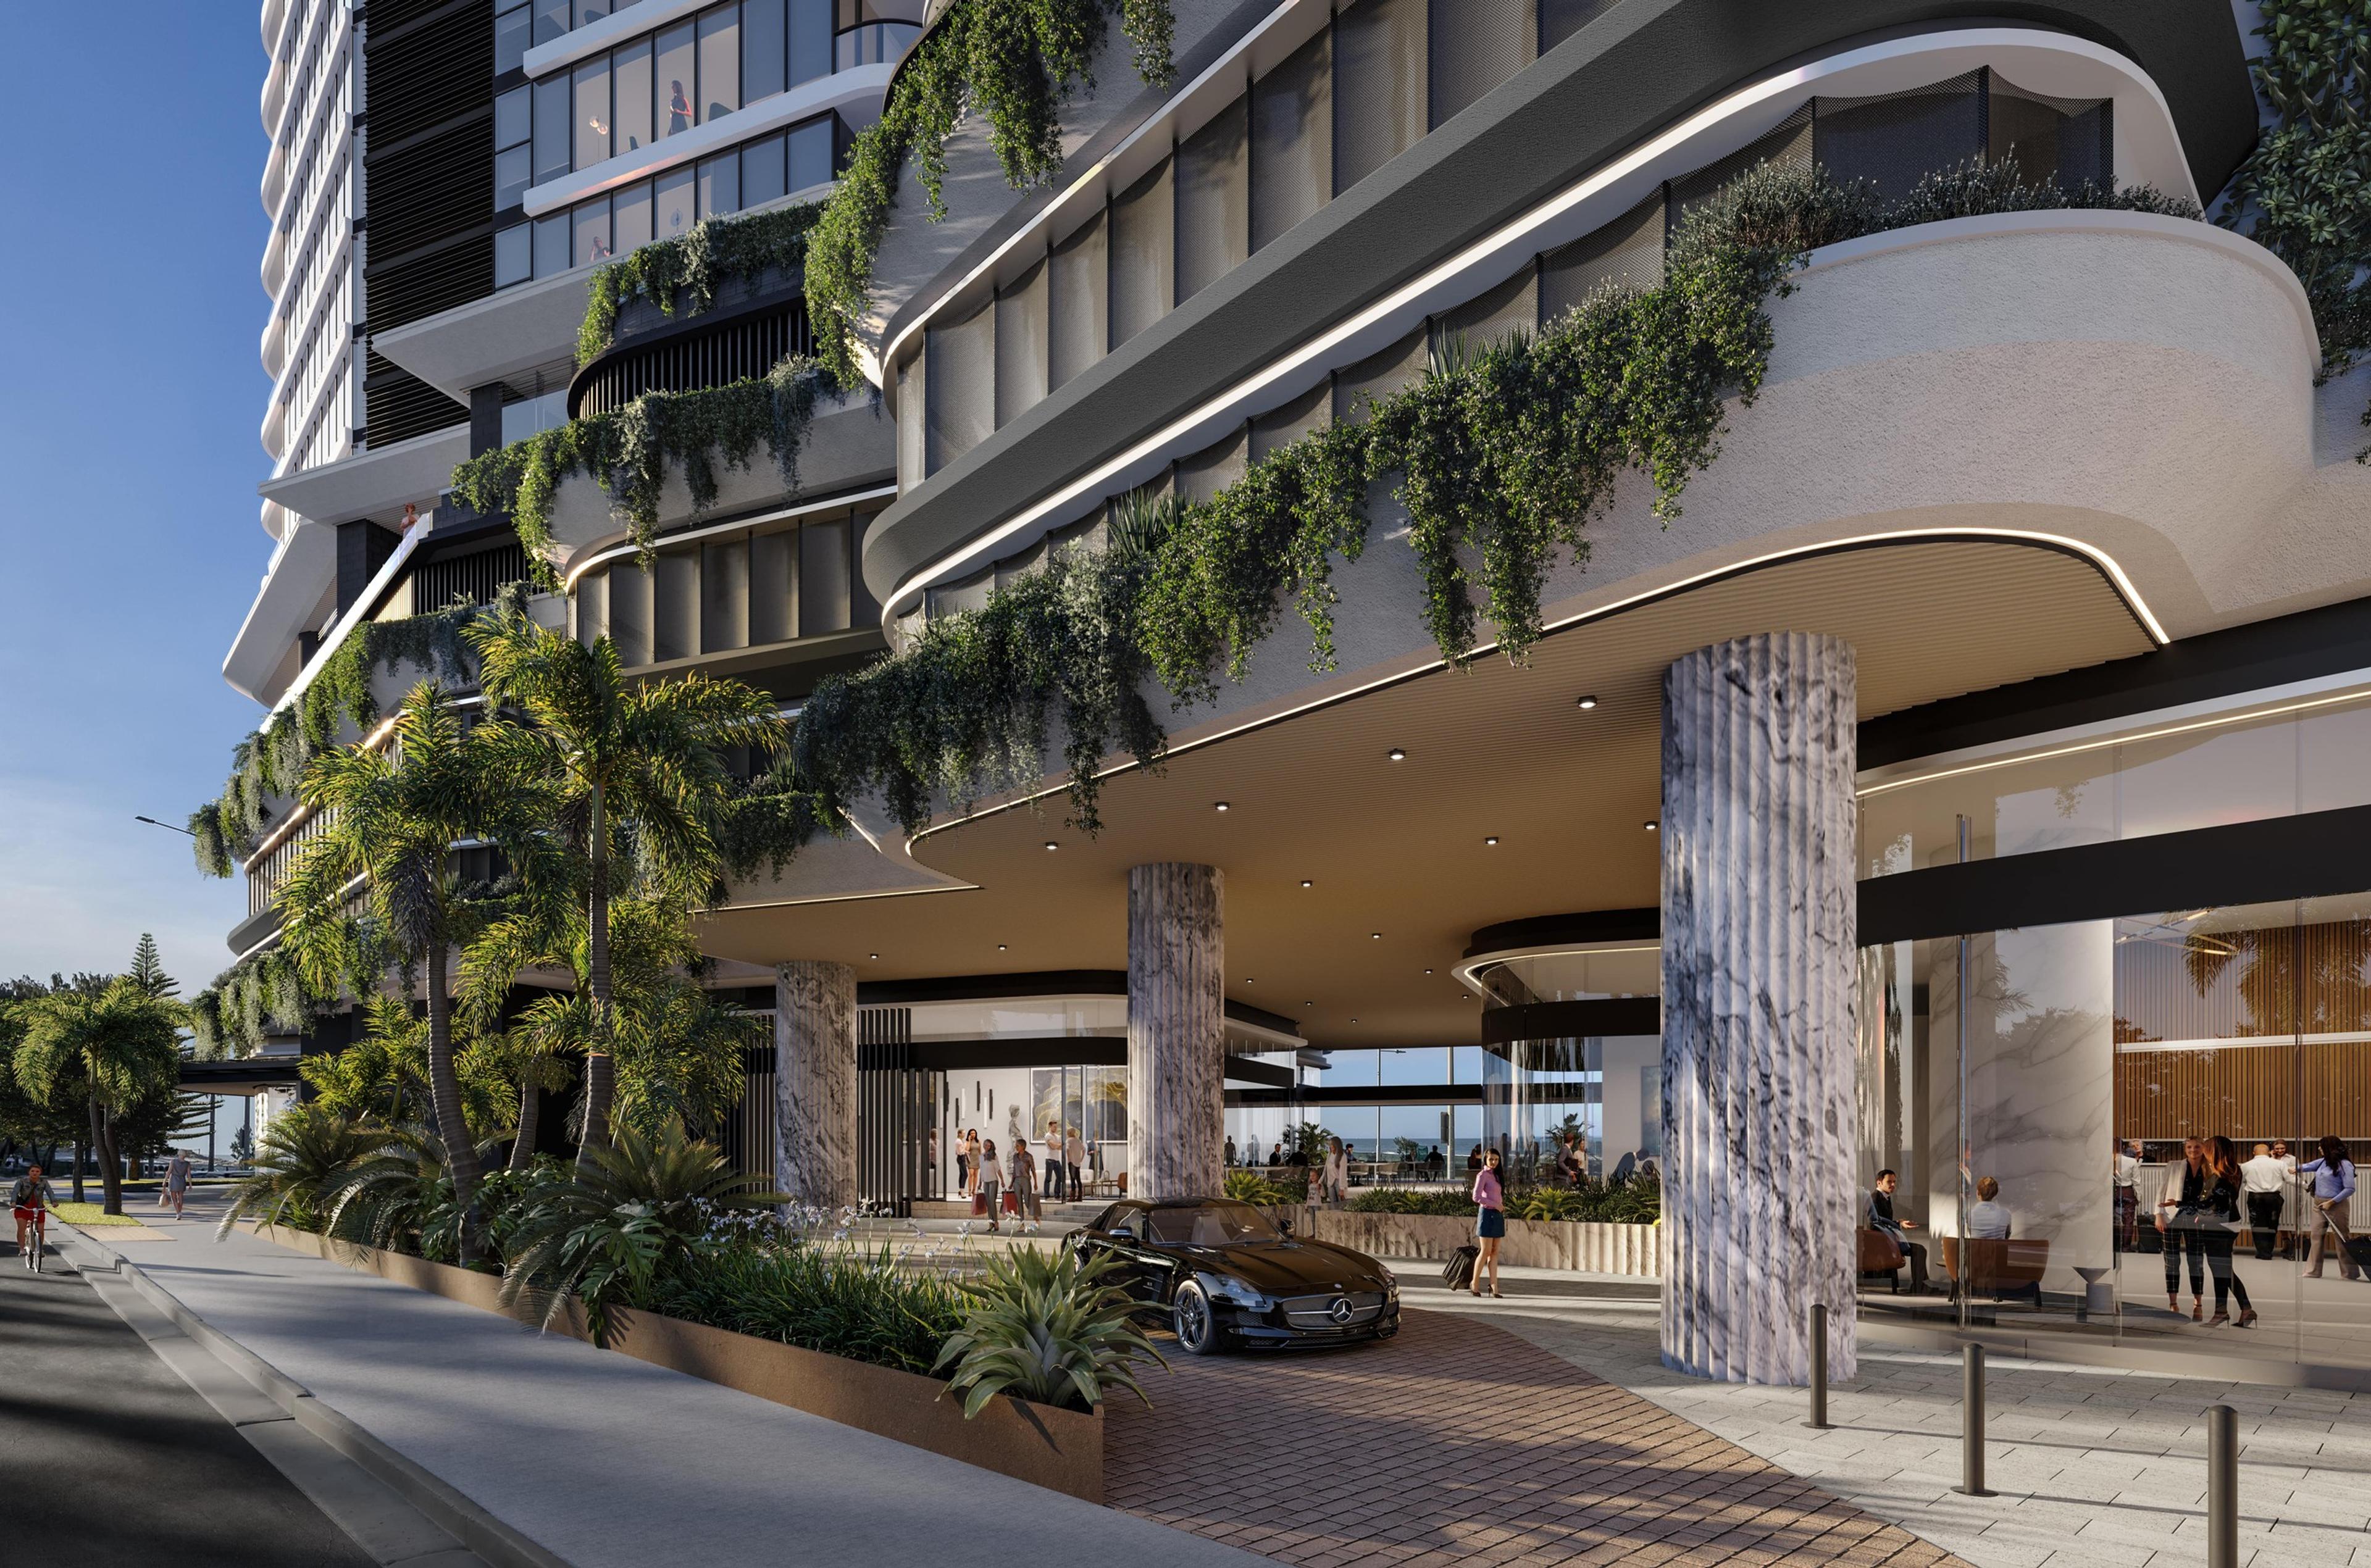
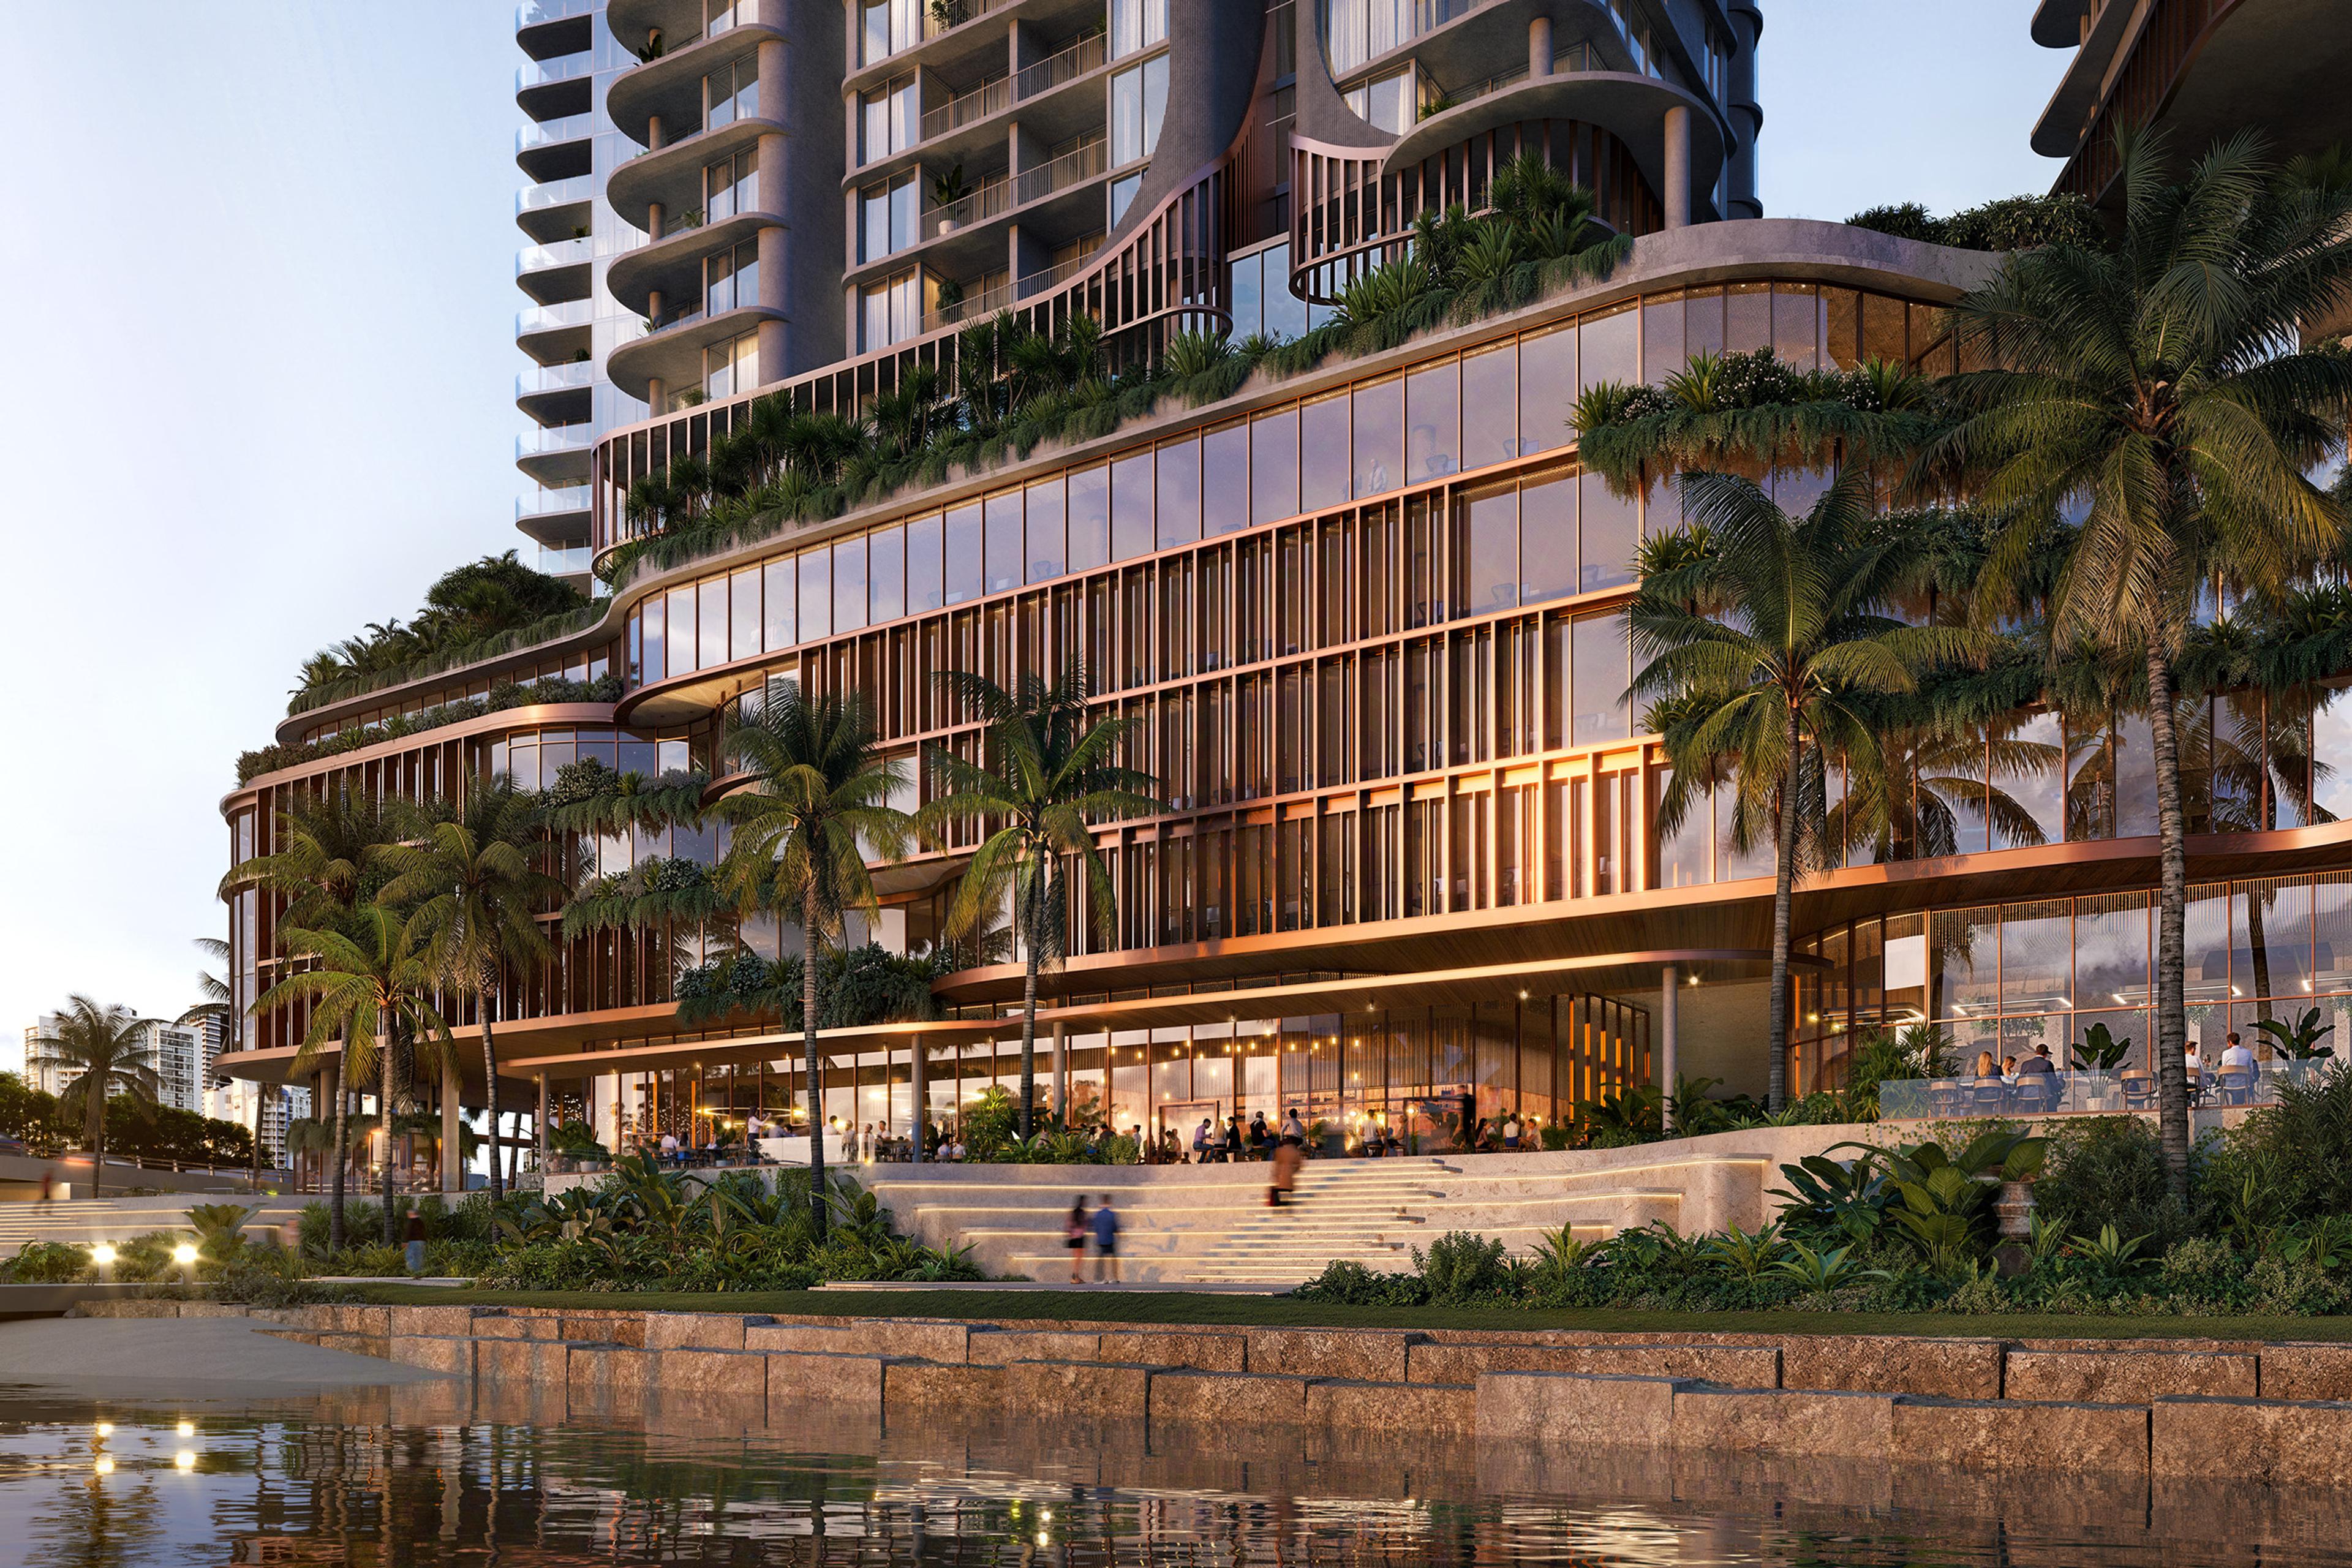
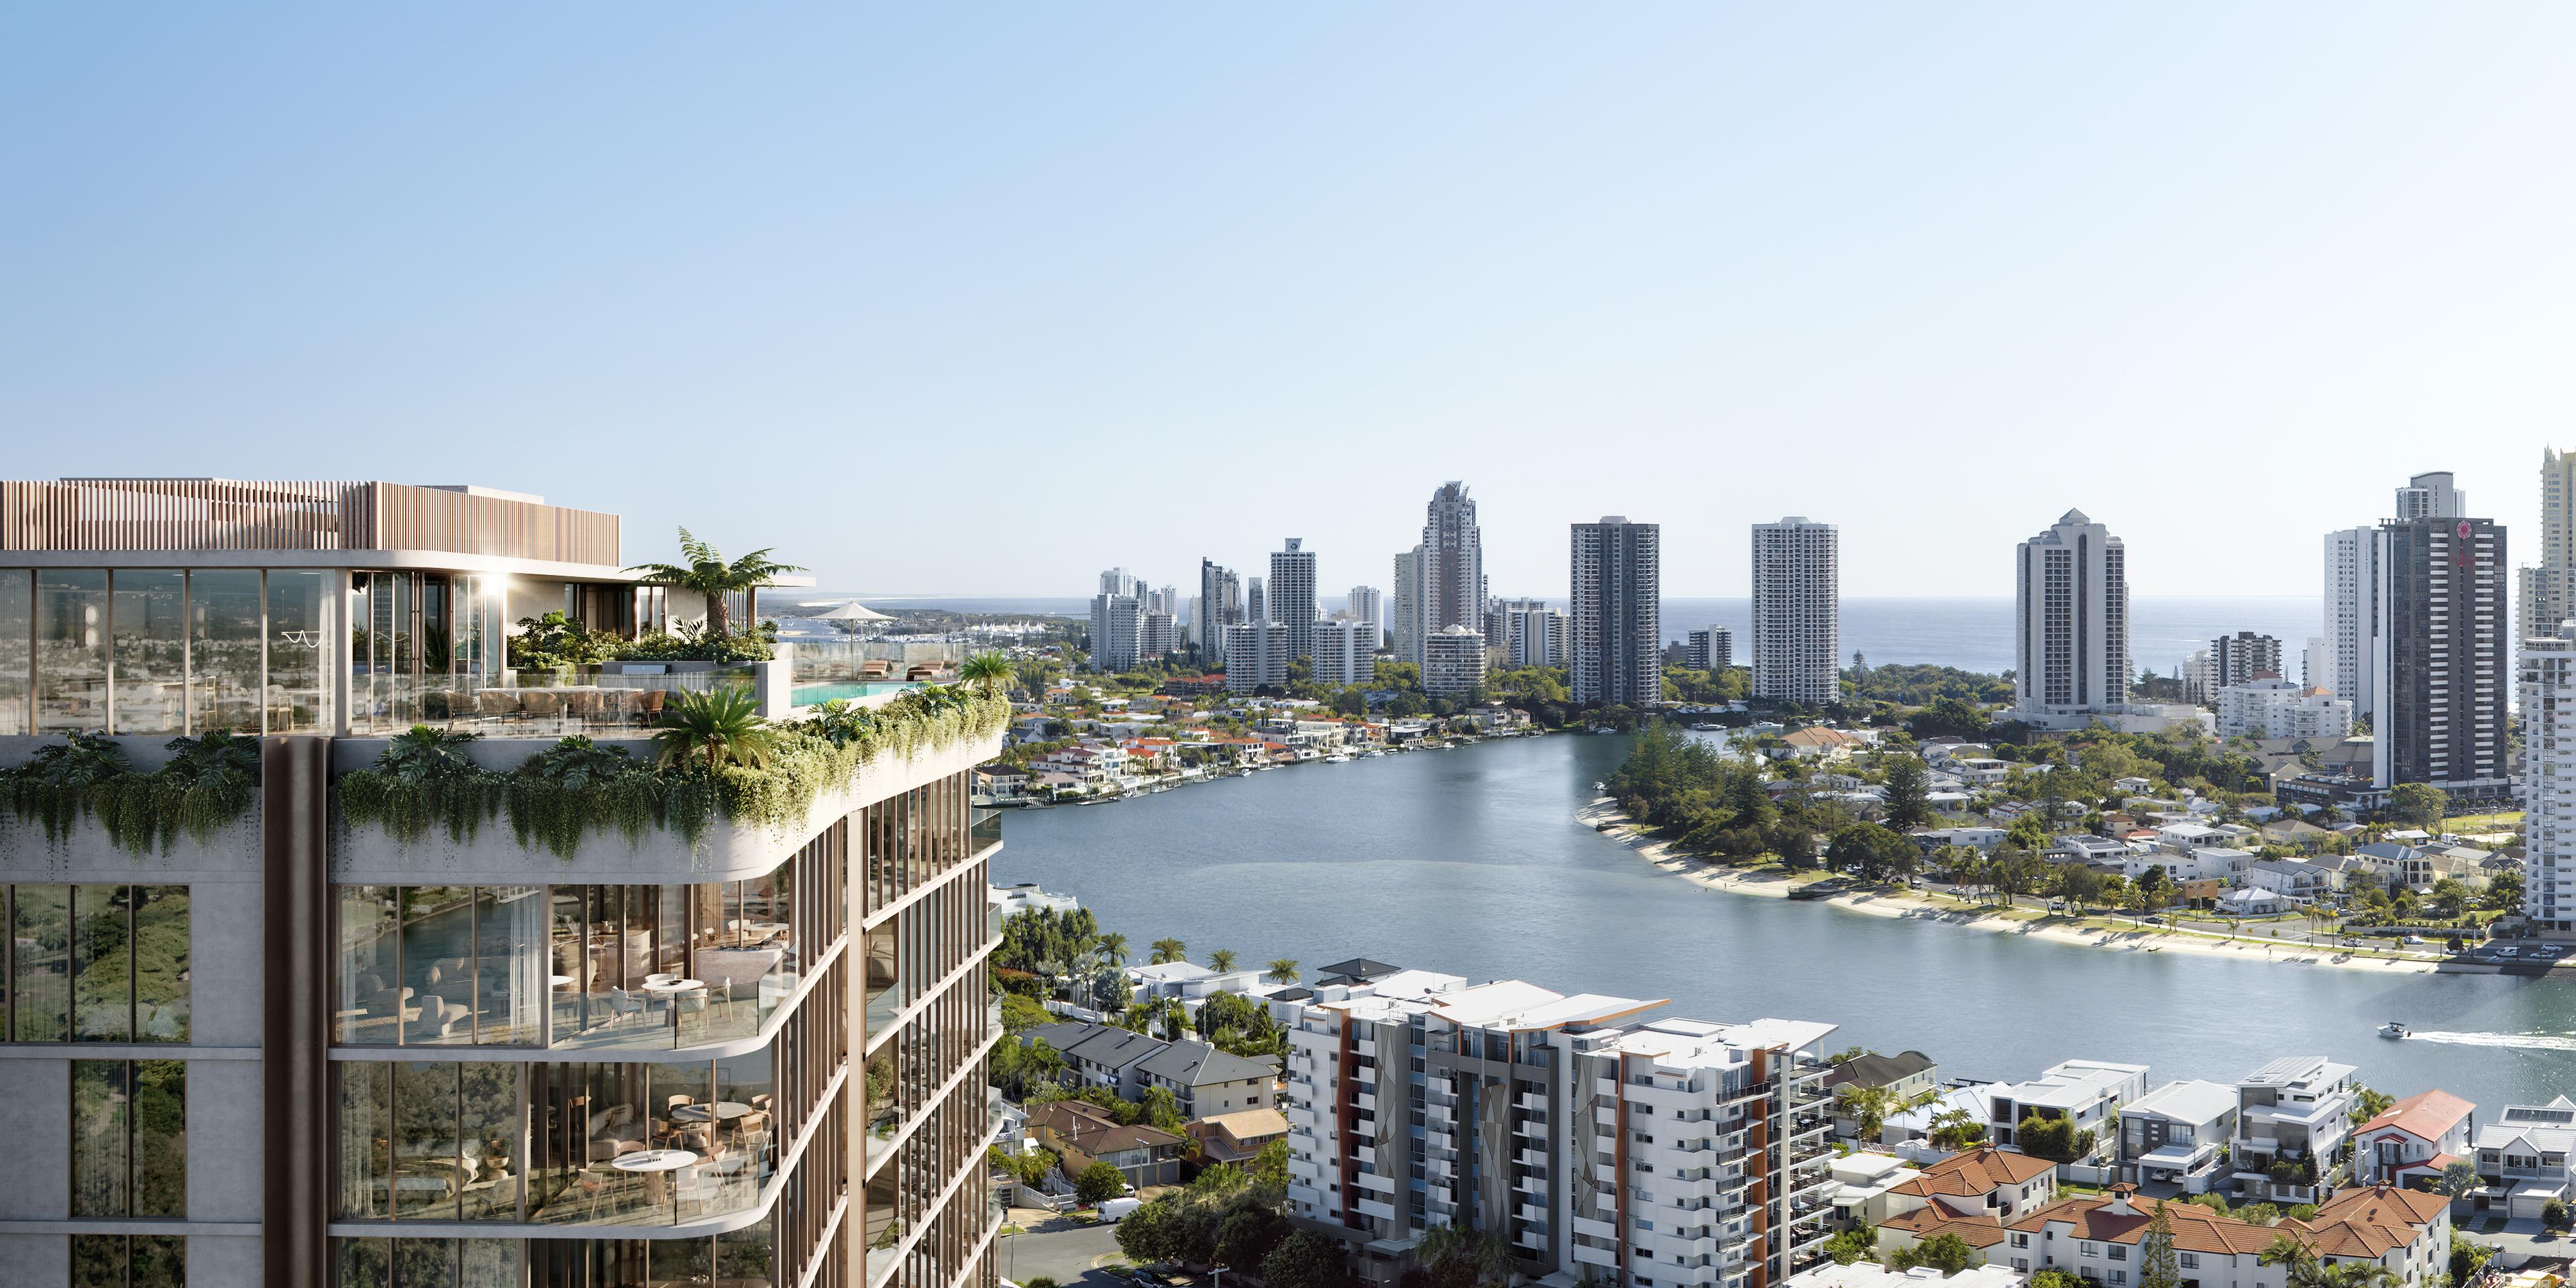
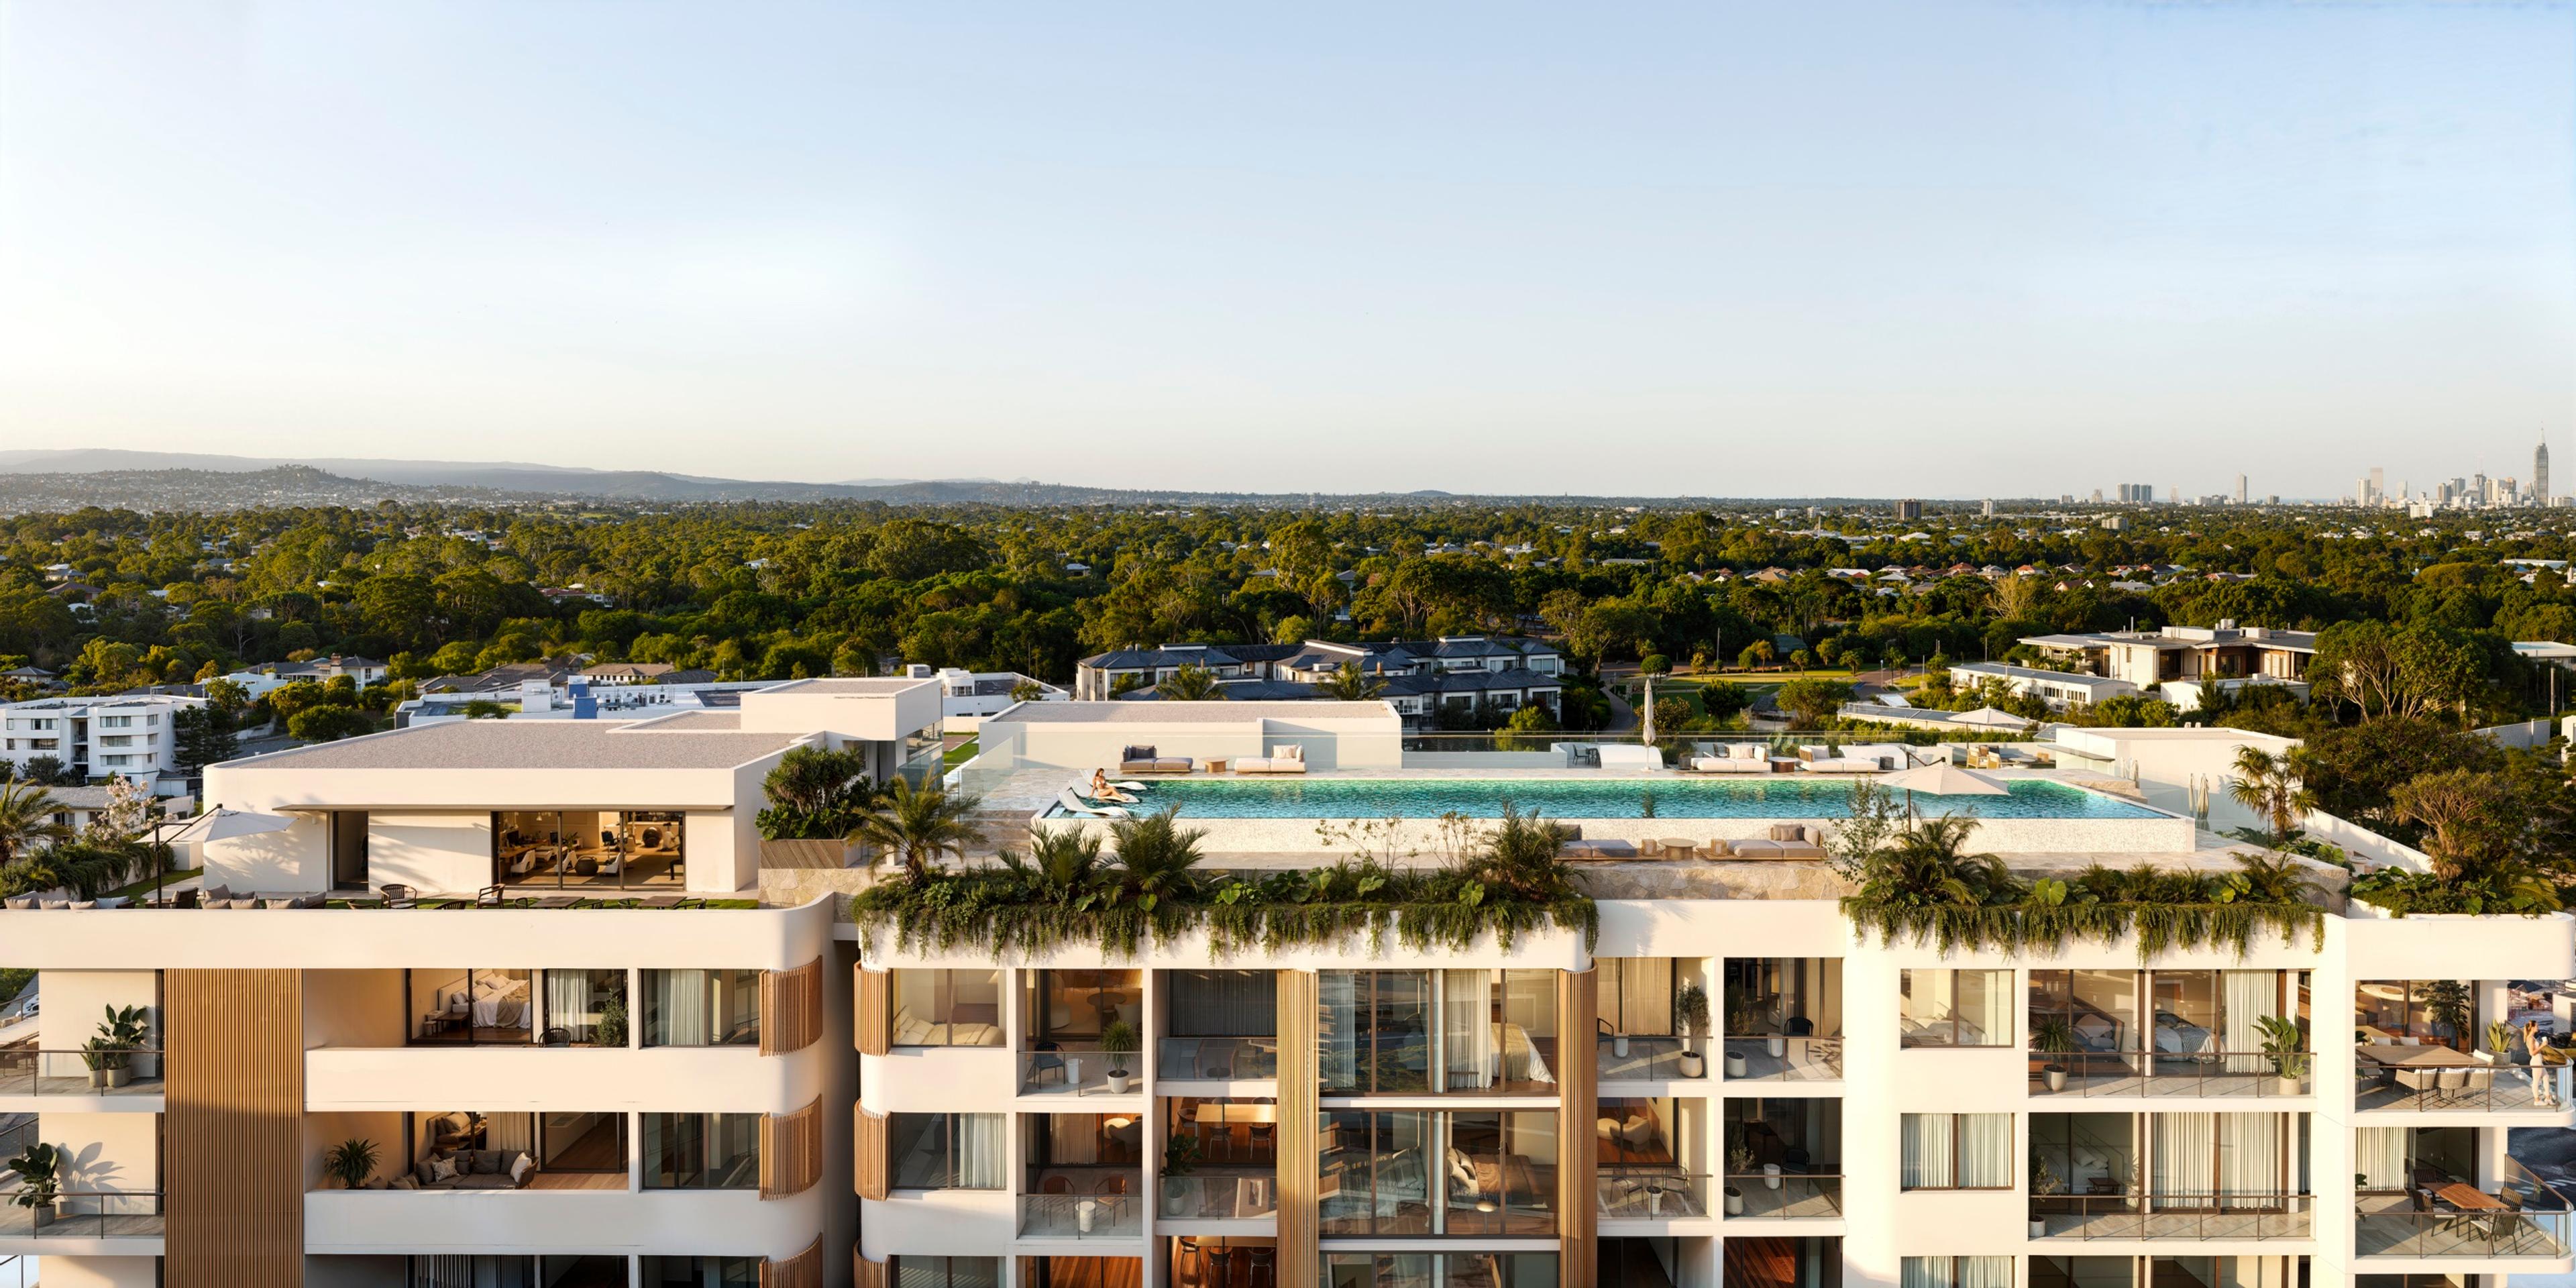
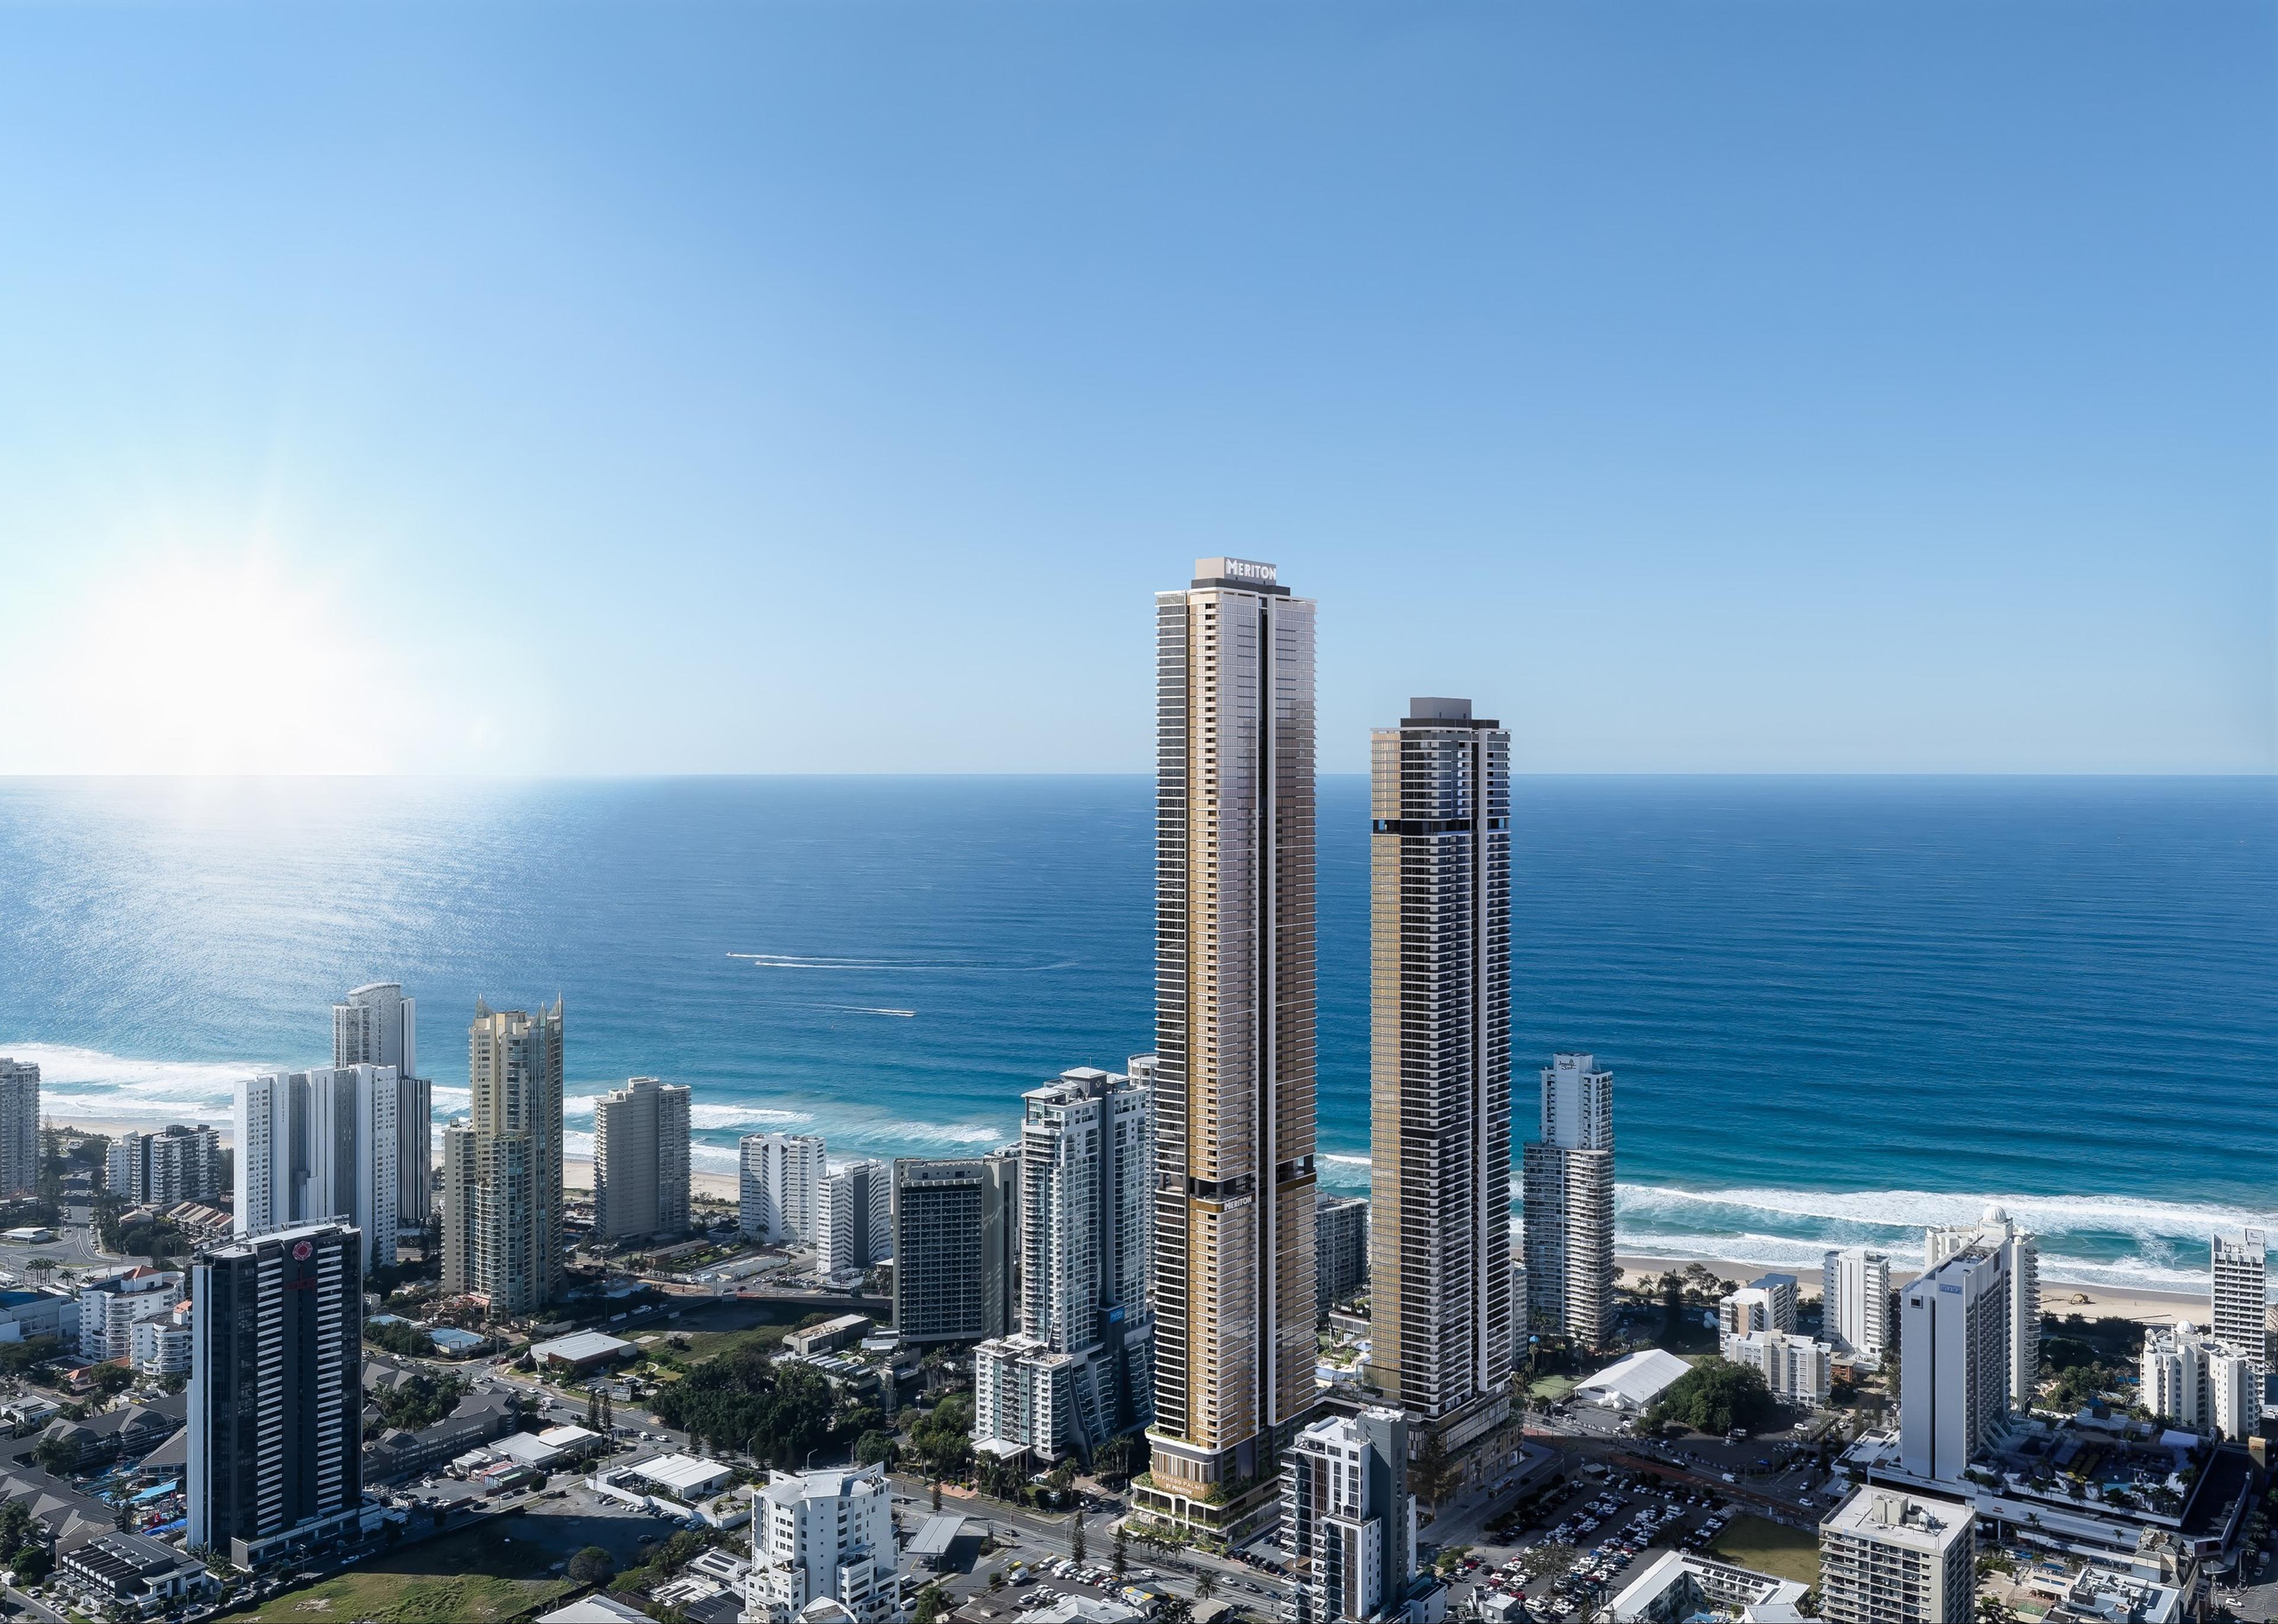
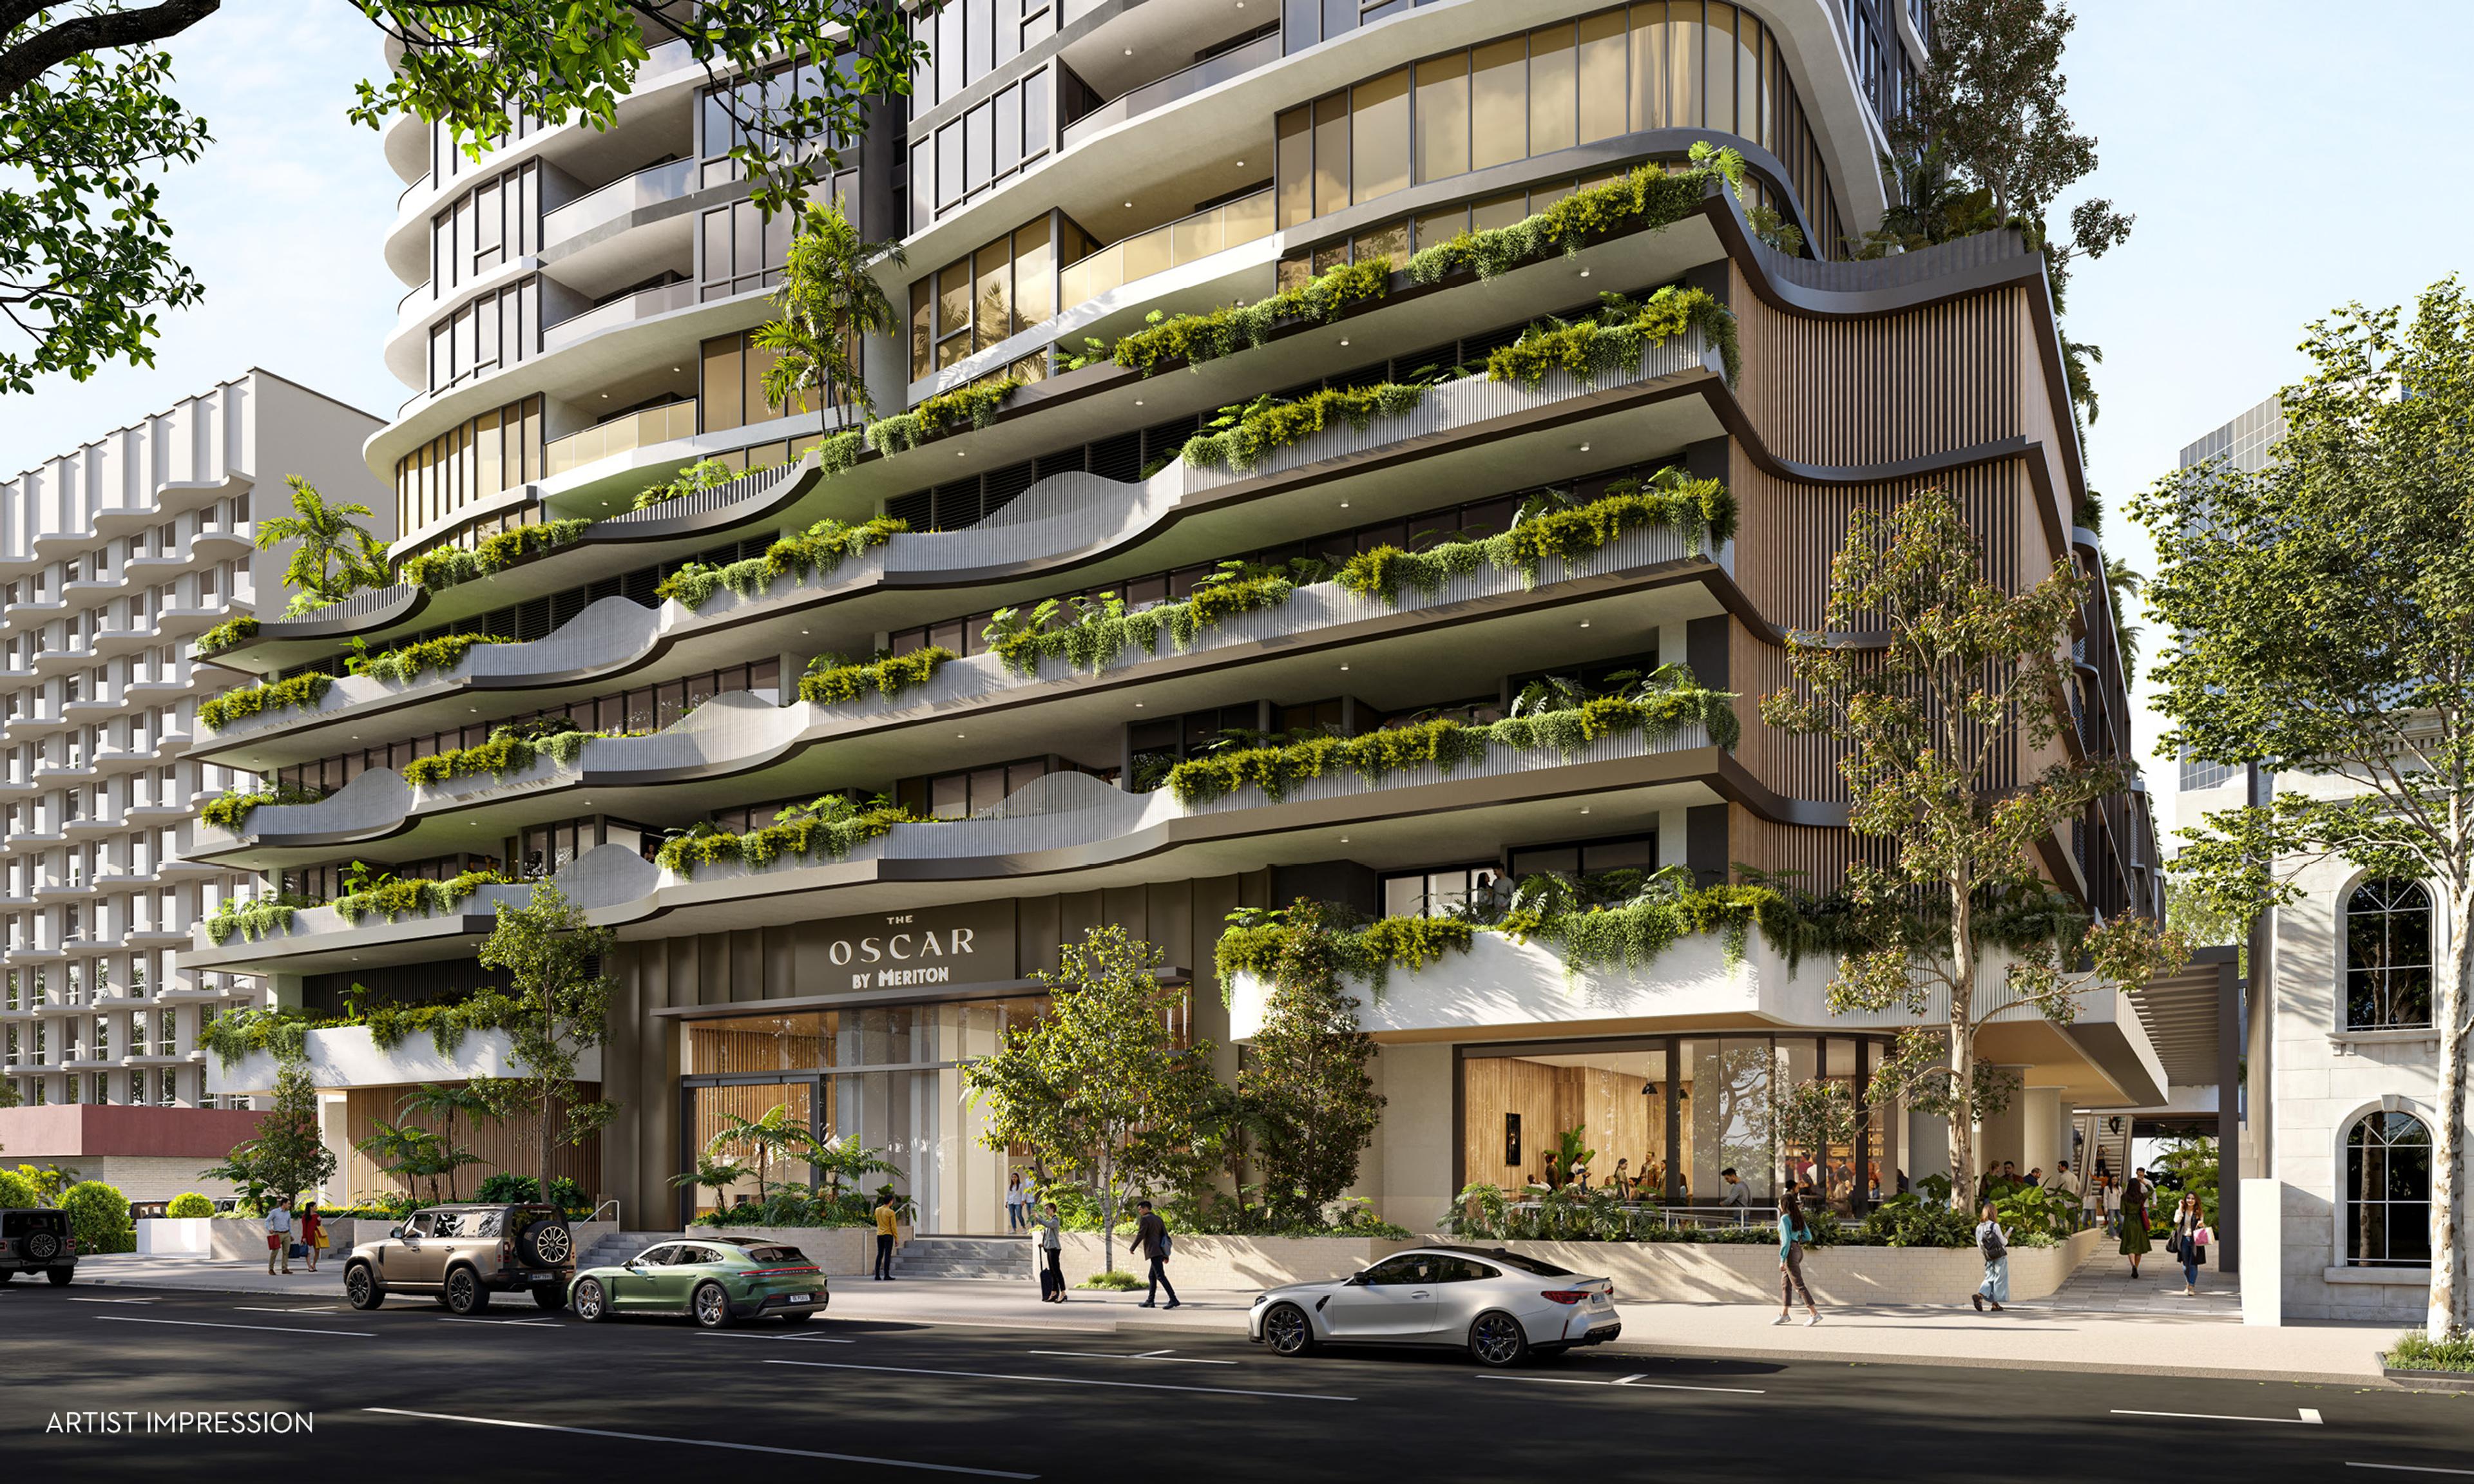
Swipe to exploreScroll or drag to explore→
8 developments
The Sydney Property Market.
Framed by one of the world's most spectacular natural harbours and bound between the Pacific Ocean, the Blue Mountains, and protected national parks, Sydney commands preeminent global standing. As Australia's financial and corporate capital, the city possesses deep institutional liquidity and private wealth that underpin the nation's most resilient property market. The immutable topography of the Sydney Basin places a permanent restriction on land availability, creating structural supply constraints that have historically insulated capital values across every property cycle.
In response to an affluent population of downsizers and corporate leaders, Sydney's prime residential market has embraced architecturally distinguished, house-sized apartments. Boutique residential collections in premier harbourside and inner-ring enclaves focus on spatial generosity, acoustic perfection, and timeless materiality. Featuring honed European limestone, bespoke joinery, private lift lobbies, and landscaped garden terraces, these residences deliver the prestige and scale of an expansive standalone house with the security and freedom of a lock-and-leave home.
Sydney's lifestyle fabric is celebrated for its diversity and elegance. From the refined village cafes of Double Bay and Mosman to the coastal parklands of the Eastern Suburbs and the culinary dining of Barangaroo, the city offers unmatched daily refinement. The transformational opening of the Sydney Metro City and Southwest line has revolutionized urban transit, whisking residents from leafy lower north shore pockets directly beneath Sydney Harbour and into Martin Place in minutes.
For discerning property investors, Sydney represents the benchmark for capital preservation and persistent tenant demand. As the regional headquarters for multinational corporations, top-tier legal firms, and international investment banks, the city maintains a steady pool of high-income executive tenants seeking prime inner-ring residences. With planning restrictions ensuring that new boutique collections remain exceptionally scarce, prime Sydney real estate continues to serve as an irreplaceable anchor for generational wealth.
Sydney Market Profile
2008 – 2025 Historical Analysis
Area:
Houses Median
$1,625,000+5.5% 1yr
Houses 5-Yr Growth+47.7%
Units Median
$841,000+6.5% 1yr
Units 5-Yr Growth+25.5%
Origin:Jun 2008
Latest:Jun 2025
Source: Cotality & ABS
Stratified historical median pricing derived from ABS and Cotality transaction records. General information only, not financial advice.
Sydney Market Profile Historical Sales Records
| Quarter | Houses Median Price | Units Median Price |
|---|---|---|
| Jun 2008 | $560,000 | $350,000 |
| Sep 2008 | $558,500 | $337,000 |
| Dec 2008 | $527,000 | $335,000 |
| Mar 2009 | $546,500 | $355,000 |
| Jun 2009 | $595,000 | $372,000 |
| Sep 2009 | $595,000 | $375,000 |
| Dec 2009 | $600,000 | $385,000 |
| Mar 2010 | $660,000 | $395,000 |
| Jun 2010 | $656,000 | $410,000 |
| Sep 2010 | $650,000 | $410,000 |
| Dec 2010 | $650,000 | $407,000 |
| Mar 2011 | $665,000 | $411,000 |
| Jun 2011 | $675,000 | $415,000 |
| Sep 2011 | $660,000 | $420,000 |
| Dec 2011 | $645,000 | $427,500 |
| Mar 2012 | $665,000 | $430,000 |
| Jun 2012 | $670,000 | $425,000 |
| Sep 2012 | $683,000 | $425,000 |
| Dec 2012 | $679,950 | $444,000 |
| Mar 2013 | $685,000 | $443,000 |
| Jun 2013 | $705,000 | $445,000 |
| Sep 2013 | $723,000 | $465,000 |
| Dec 2013 | $749,000 | $495,000 |
| Mar 2014 | $795,000 | $505,600 |
| Jun 2014 | $810,000 | $525,000 |
| Sep 2014 | $800,000 | $536,000 |
| Dec 2014 | $860,000 | $550,000 |
| Mar 2015 | $920,000 | $563,000 |
| Jun 2015 | $1,005,500 | $600,000 |
| Sep 2015 | $1,010,000 | $610,000 |
| Dec 2015 | $970,000 | $621,000 |
| Mar 2016 | $980,000 | $628,000 |
| Jun 2016 | $1,000,000 | $654,000 |
| Sep 2016 | $1,130,000 | $650,000 |
| Dec 2016 | $1,100,000 | $655,000 |
| Mar 2017 | $1,167,000 | $665,000 |
| Jun 2017 | $1,160,000 | $680,000 |
| Sep 2017 | $1,190,000 | $685,000 |
| Dec 2017 | $1,136,000 | $680,000 |
| Mar 2018 | $1,090,000 | $710,000 |
| Jun 2018 | $1,050,000 | $665,000 |
| Sep 2018 | $1,010,000 | $649,950 |
| Dec 2018 | $971,000 | $630,000 |
| Mar 2019 | $950,000 | $620,000 |
| Jun 2019 | $930,000 | $583,500 |
| Sep 2019 | $1,000,000 | $610,000 |
| Dec 2019 | $1,110,000 | $653,000 |
| Mar 2020 | $1,150,000 | $677,000 |
| Jun 2020 | $1,100,000 | $670,000 |
| Sep 2020 | $1,101,500 | $655,000 |
| Dec 2020 | $1,185,000 | $670,000 |
| Mar 2021 | $1,320,000 | $676,000 |
| Jun 2021 | $1,400,000 | $720,000 |
| Sep 2021 | $1,510,000 | $745,000 |
| Dec 2021 | $1,600,000 | $760,000 |
| Mar 2022 | $1,550,000 | $755,000 |
| Jun 2022 | $1,500,000 | $755,000 |
| Sep 2022 | $1,430,000 | $750,000 |
| Dec 2022 | $1,350,000 | $720,000 |
| Mar 2023 | $1,380,000 | $730,000 |
| Jun 2023 | $1,430,000 | $737,000 |
| Sep 2023 | $1,460,000 | $745,000 |
| Dec 2023 | $1,530,000 | $763,087 |
| Mar 2024 | $1,500,000 | $775,000 |
| Jun 2024 | $1,540,000 | $790,000 |
| Sep 2024 | $1,565,000 | $793,000 |
| Dec 2024 | $1,550,000 | $815,000 |
| Mar 2025 | $1,560,000 | $820,000 |
| Jun 2025 | $1,625,000 | $841,000 |